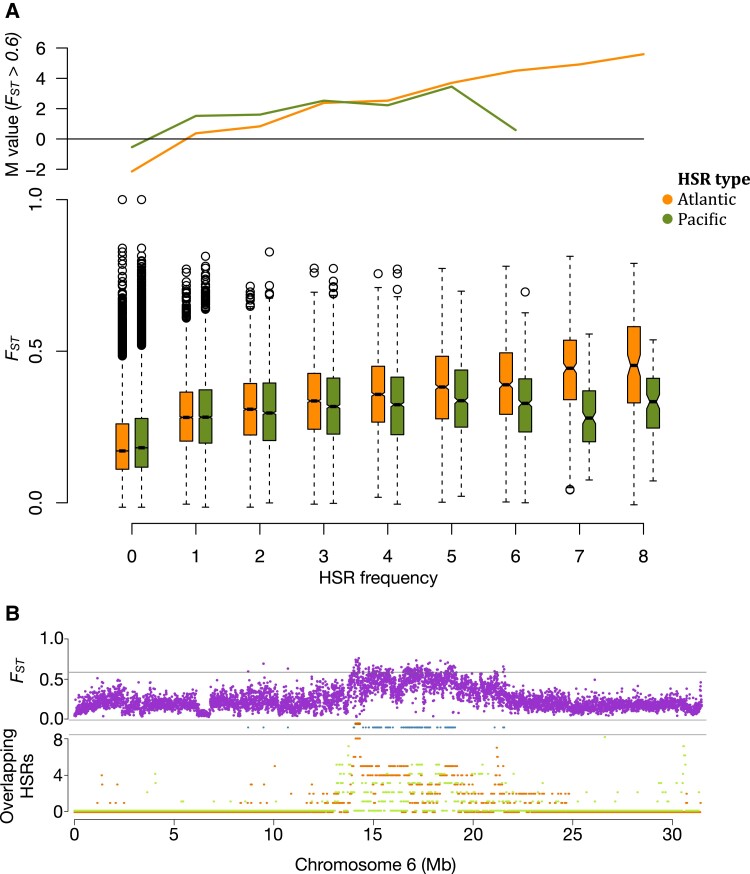
Fig. 7.
Correlation between HSRs in Balsfjord herring and estimated FST between Atlantic and Pacific herring. A) Boxplots showing the FST distribution for regions binned by the number of recurring HSRs. Atlantic HSRs are shown in orange, Pacific ones in green. M-values are based on comparing FST values within introgressed regions against the genomic average abundance of 5 kb blocks with FST > 0.6. B) HSR coverage (bottom track: Atlantic in orange, Pacific in green) and inter-species FST (top track: the grey line is the high FST threshold of 0.6) and their overlap (mid track: blue bars indicate high FST (>0.6) regions, orange bars indicate regions that have both high FST and eight Atlantic HSRs) shown across chromosome 6, as an example of their co-variation. See supplementary figure S12, Supplementary Material online for all chromosomes.

