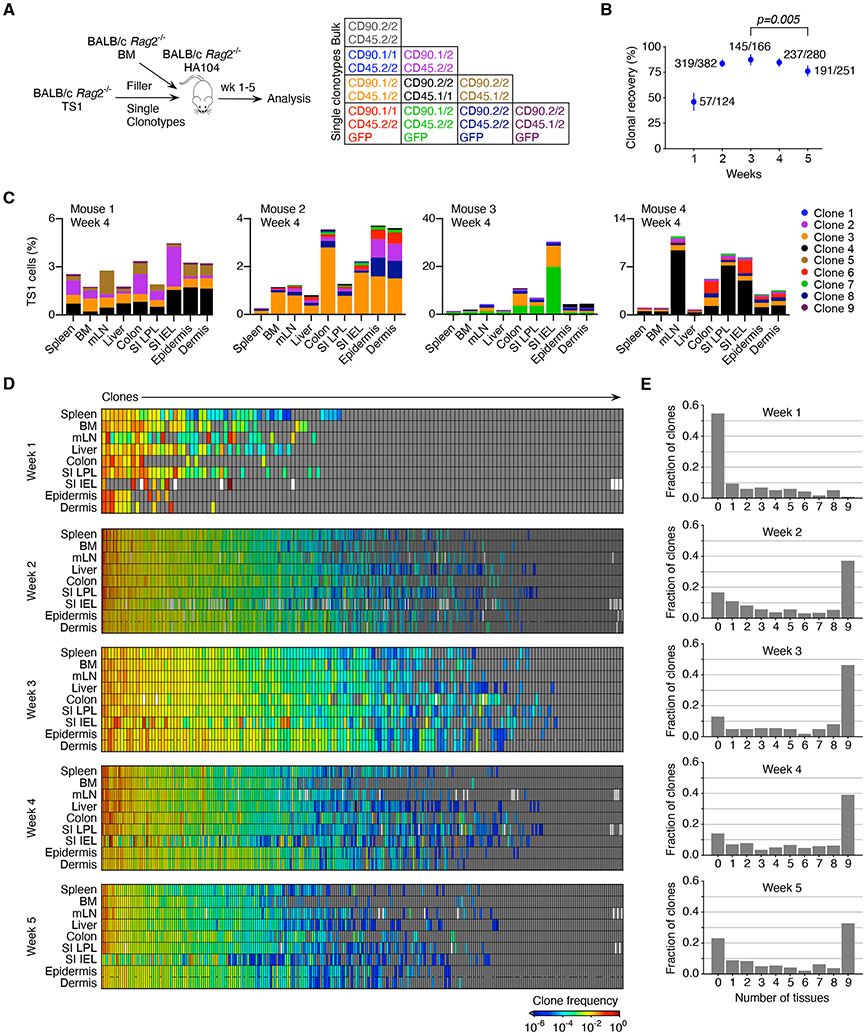
Figure 1. TS1 clonal progeny distribute unequally.
(A) Experimental design. Irradiated BALB/c Rag2−/− HA104 mice were reconstituted with BALB/c Rag2−/− BM, 500 TS1 of one clonotype and single cell-sorted TS1 of 6-8 additional clonotypes. (B) Percentages of infused clones (#detected/#infused) recovered at analysis timepoints; error bars represent 95% confidence intervals obtained with nonparametric Bootstrap 57. Statistical significance was determined by Fisher’s exact test. (C) Clone distributions in 4 representative mice. Each mouse received 6-8 of 9 possible clones. (D) Clone frequencies represented as a heat map (see Supplemental Methods) at each time point. Each cell in a column depicts the frequency of a single clone in a single mouse in each tissue. Clones are ordered left to right from highest to lowest frequency. White rectangles indicate technical failures in cell isolations and gray boxes represent clones that were not detected. (E) Fraction of clones detected in 0-9 tissues. Data are from the analysis of 1203 infused clones recovered from a total of 186 mice (17 at week 1; 61 at week 2; 30 at week 3; 38 at week 4; and 40 at week 5. See Figure S1.

