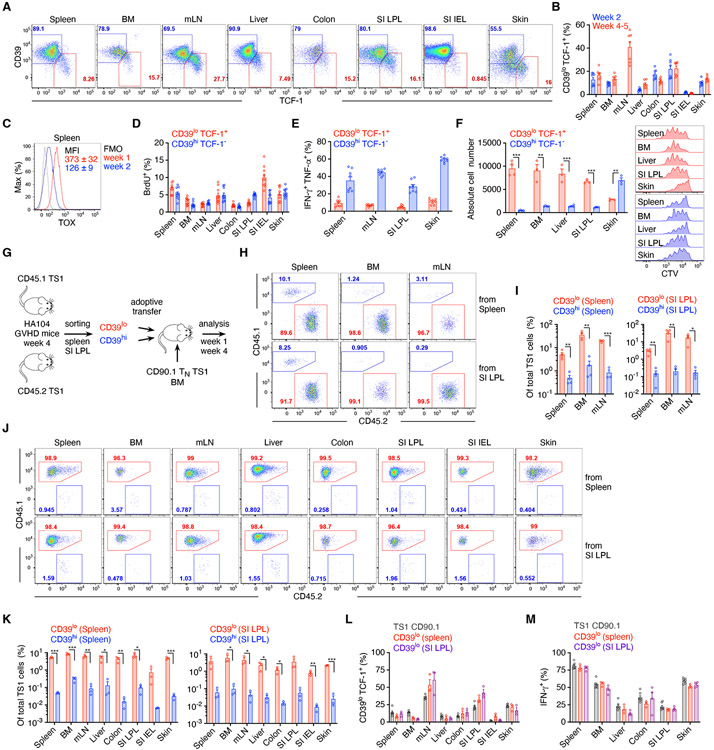
Figure 7. TCF-1+ T cells develop and have greater proliferation and survival.
(A) Representative CD39 and TCF-1 staining, 5 weeks post-transplantation. (B) Frequencies of CD39hiTCF-1− and CD39loTCF-1+ TS1 cells at the indicated times post-transplantation. (C) TOX expression of splenic TS1. (D) Percentage of BrdU+ CD39hiTCF-1− and CD39loTCF-1+ TS1 cells from the indicated tissues, 5 weeks post-transplantation. (E) Frequencies of IFN-γ+TNF-α+ among CD39hiTCF-1− and CD39loTCF-1+ TS1 cells 4 weeks post-transplant after stimulation with S1 peptide-pulsed splenocytes. (F) CD39hi and CD39lo TS1 cells sorted from the indicated tissues 4 weeks post-transplant were cultured with S1 peptide-pulsed splenocytes. Numbers of cells and representative CTV dilution histograms are shown. (G) Design for the competitive adoptive transfer experiments. (H-K) Recipients were analyzed 1 (H, I) and 4 weeks (J, K) post-transplant. (H, J) Representative flow cytometry. (I, K) Percentages of total TS1 cells derived from the progeny of adoptively transferred CD39lo and CD39hi TS1 cells. (L, M) Percentages of CD39loTCF-1+ (L) and IFN-γ+ (M) cells among progeny of adoptively transferred CD39lo and naïve TS1 cells. Data are representative of 2 independent experiments (A, D-L), or pooled from one (C, M) or two (B) experiments with n=3-4 mice/group per experiment. Bar graphs depict means ± SEM. Statistical significance was determined by two-tailed Student’s t-test (p*<0.05, p**<0.01, p***<0.001). See Figure S7.

