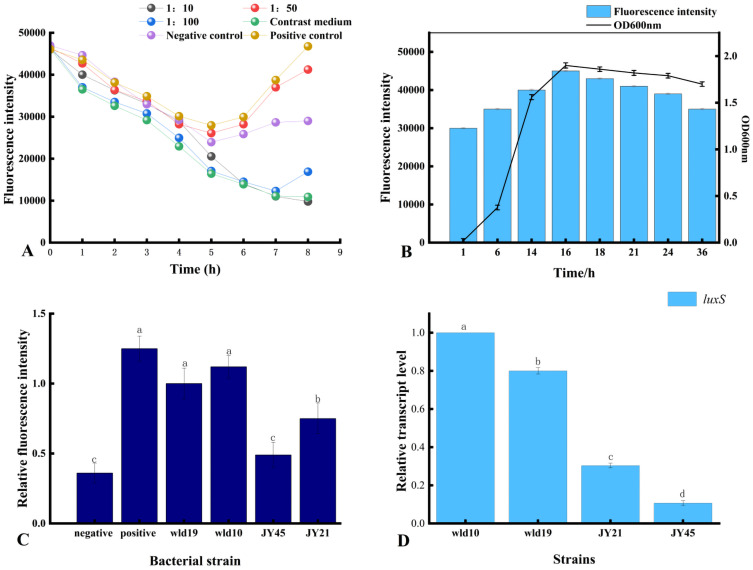
Figure 5.
Optimization of the detection method for the signaling molecule AI-2. (A) The optimization of the optimal detection conditions of AI-2. (B) The relationship between AI-2 activity and density value in strain wld10. (C) The comparison of fluorescence intensity of AI-2 in each strain. (D) The expression level of luxS gene in each strain, which is responsible for the high-yielding AI-2 signal, in S. aureus. The alphabets a, b, c, and d indicate differences between groups, while the same alphabet indicate little to no variation between samples. If the samples have different alphabet, there is a significant difference between them (P< 0.05).

