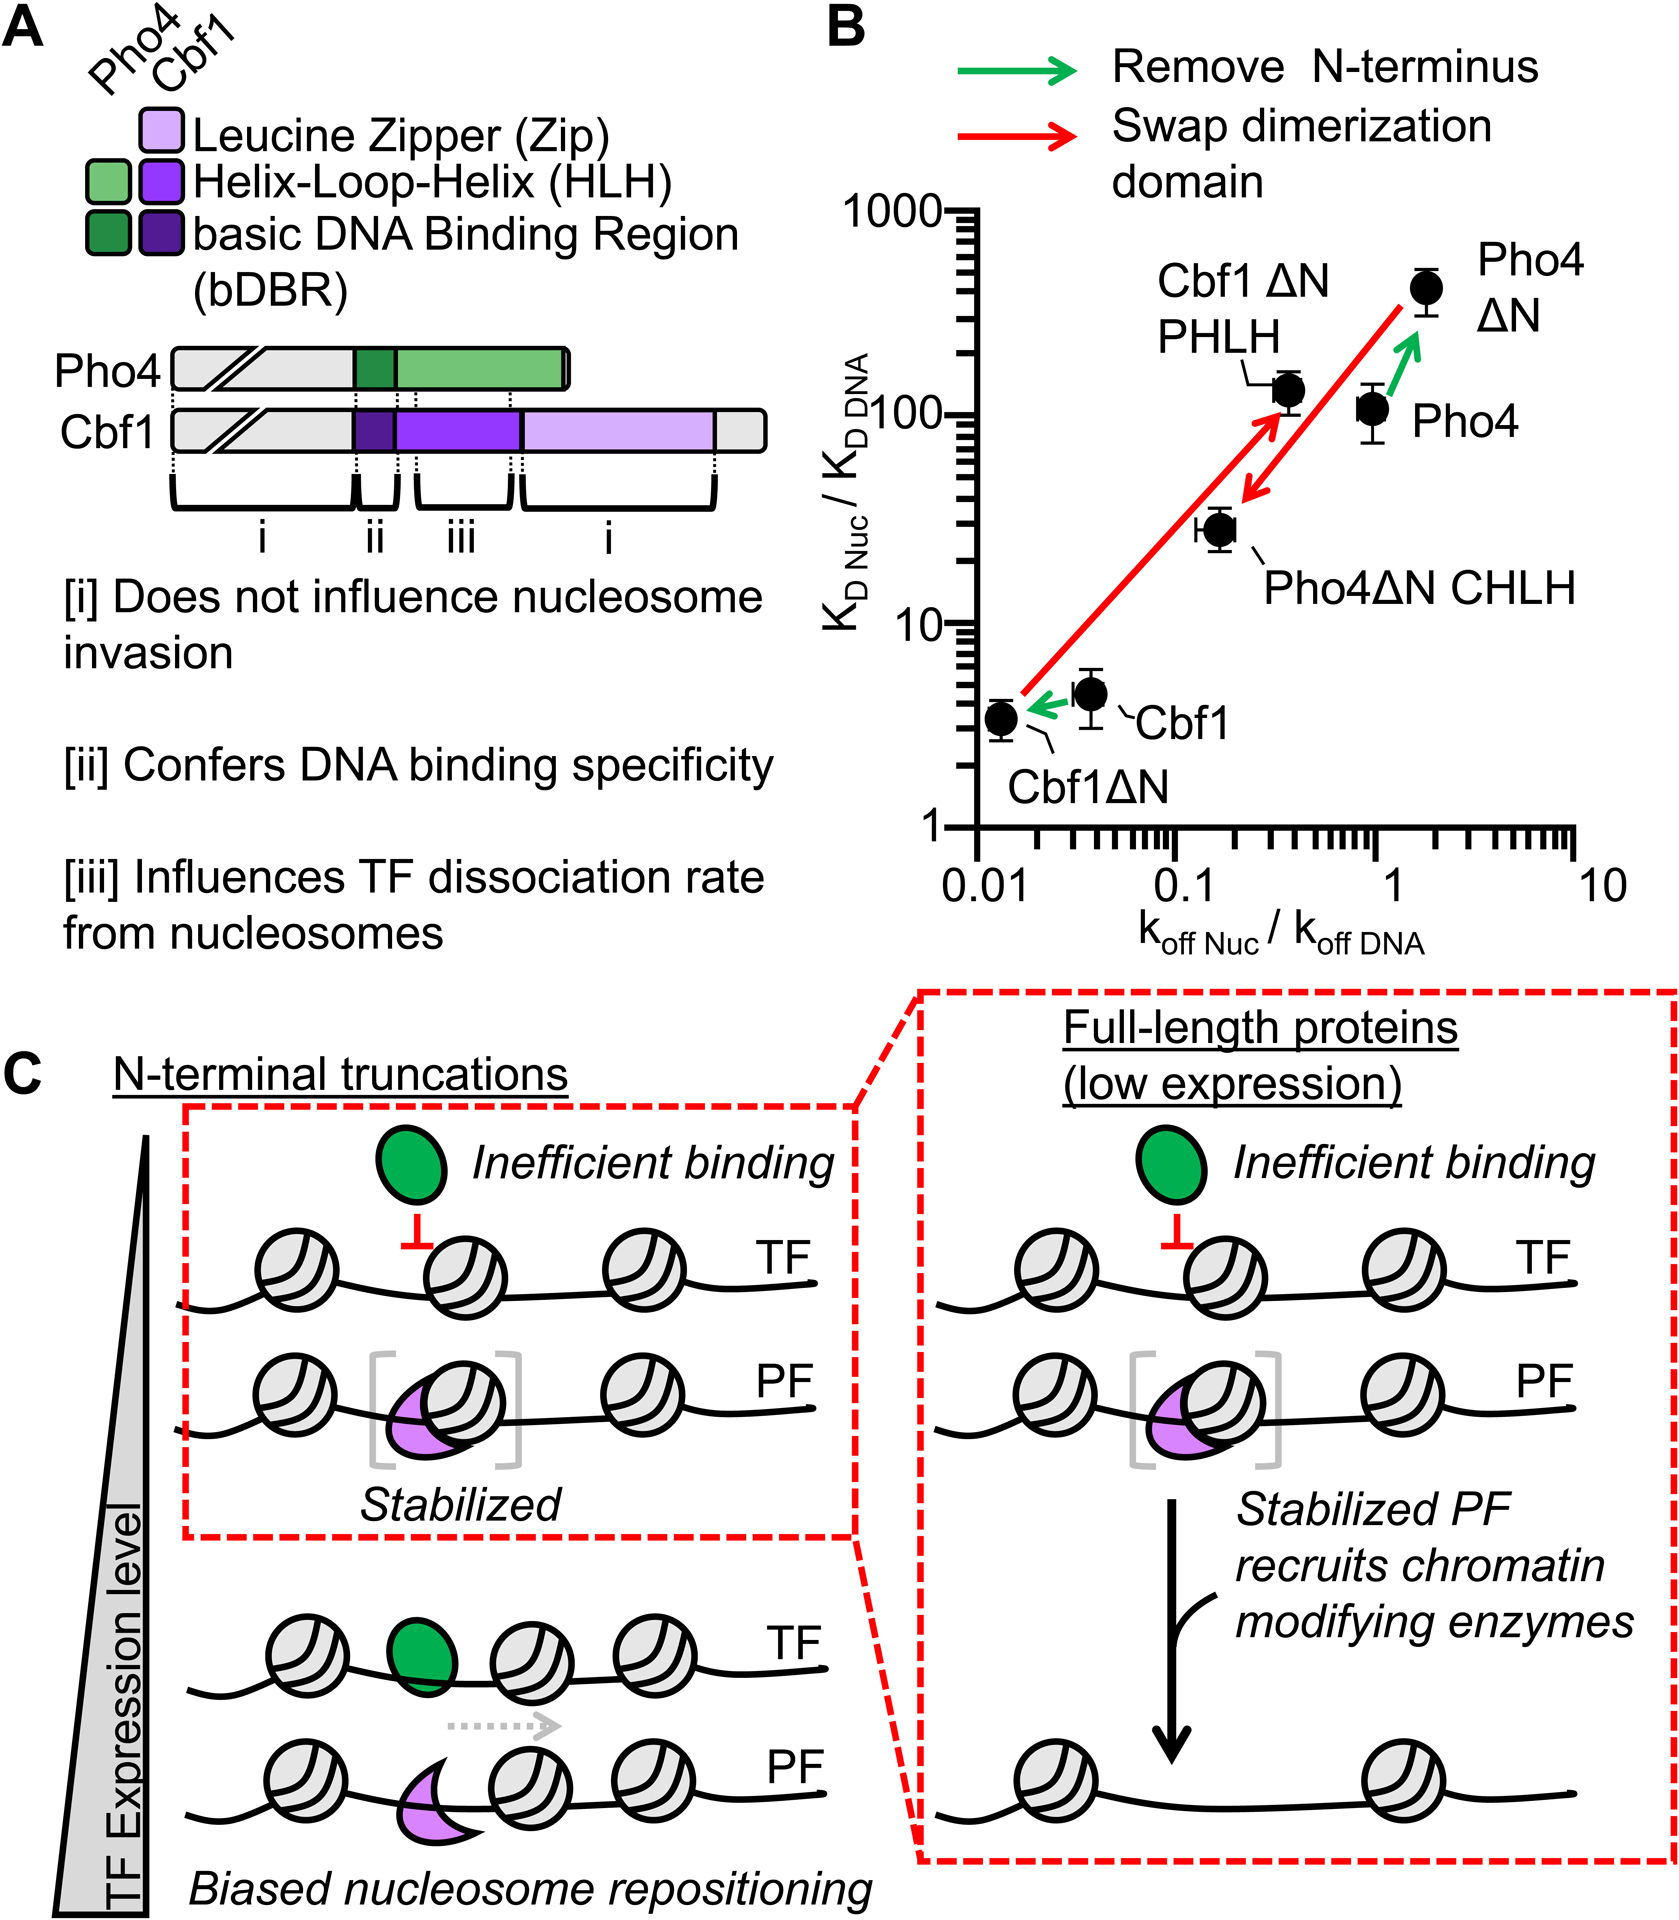
Figure 6. The Cbf1 and Pho4 HLH regions define their ability to invade nucleosomes in vitro and reposition nucleosomes in vivo.

(A) Domain diagrams of full-length Pho4 and Cbf1 with the regions denoted by brackets on how they influence nucleosome invasion. (B) Log-log plot relating the efficiency of nucleosome invasion (KD Nuc/KD DNA, y-axis) to the relative dissociation rate (koff Nuc /koff DNA, x-axis). Each point on this plot represents a different measurement from this study or Donovan et al.14 The arrows between points indicate how specific mutations change relative dissociation rate and the corresponding efficiency of nucleosome invasion. (C) Model of nucleosome invasion and displacement by bHLH PFs that rely on the dissociation rate compensation mechanism and canonical bHLH TFs that are inhibited by nucleosomes.
