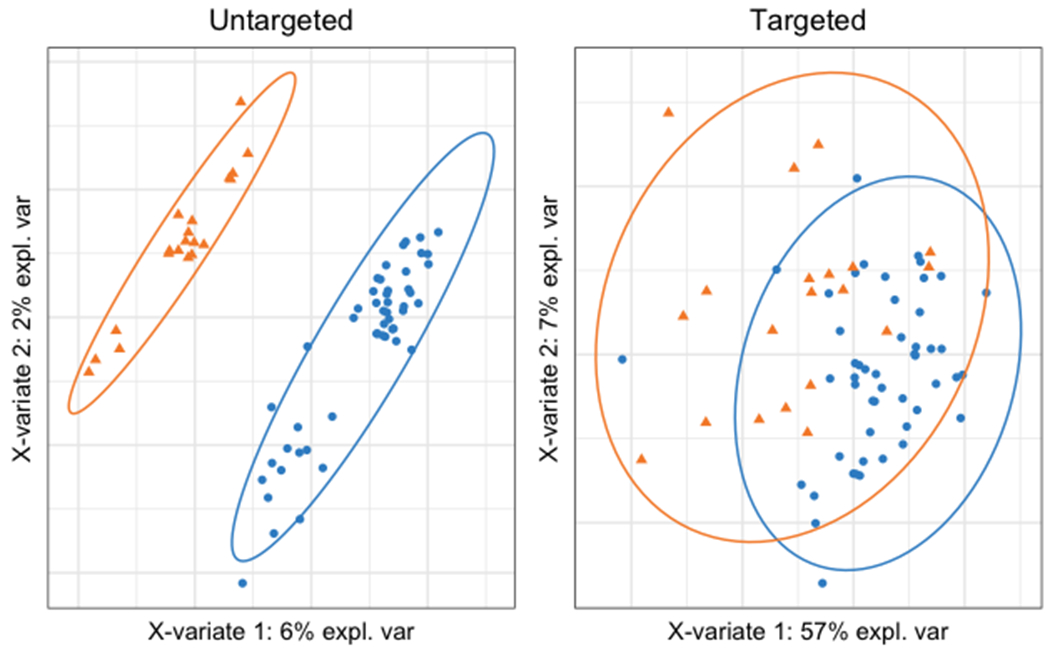
Figure 1. Sample plots from the sPLS-DA of targeted (left panel) and untargeted (right panel) metabolomics.

Orange triangles represent controls and blue circles represent participants with T1DM. X-variate 1 is the first component of PLS-DA and X-variate 2 is the second component. PLS-DA performed using the untargeted metabolites resulted in better separation between groups than PLS-DA using targeted metabolites.
