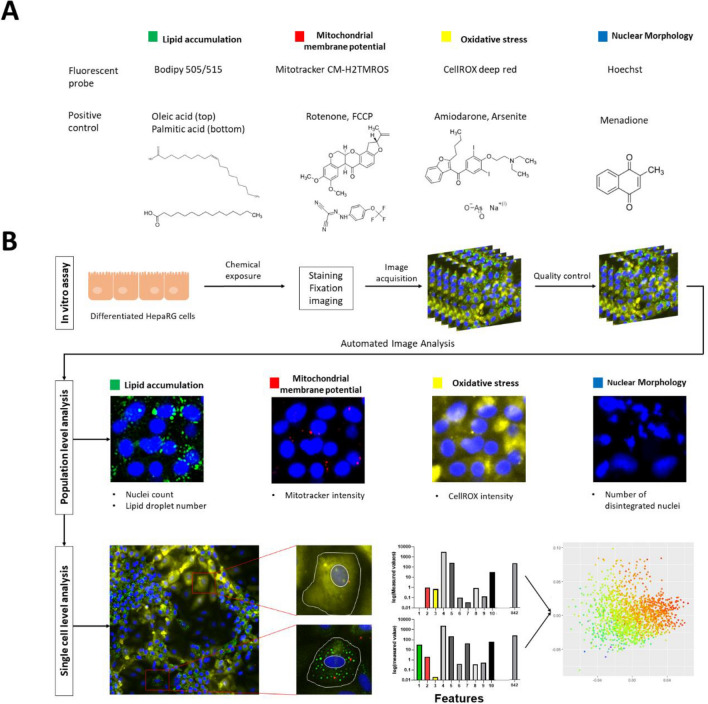
Fig. 1.
Basis of high-content imaging assay. A Fluorescent probes for the selected endpoints including corresponding positive controls. B Description of the workflow including rapid population-based quantification and detailed single cell analysis. During single cell level analysis, over 800 different features (intensity, size/shape, and texture) per cell were quantified and analyzed using principal component analysis (PCA). Plotted data were then color labeled using the values from following parameters: lipid droplet size, mitotracker intensity and CellROX intensity

