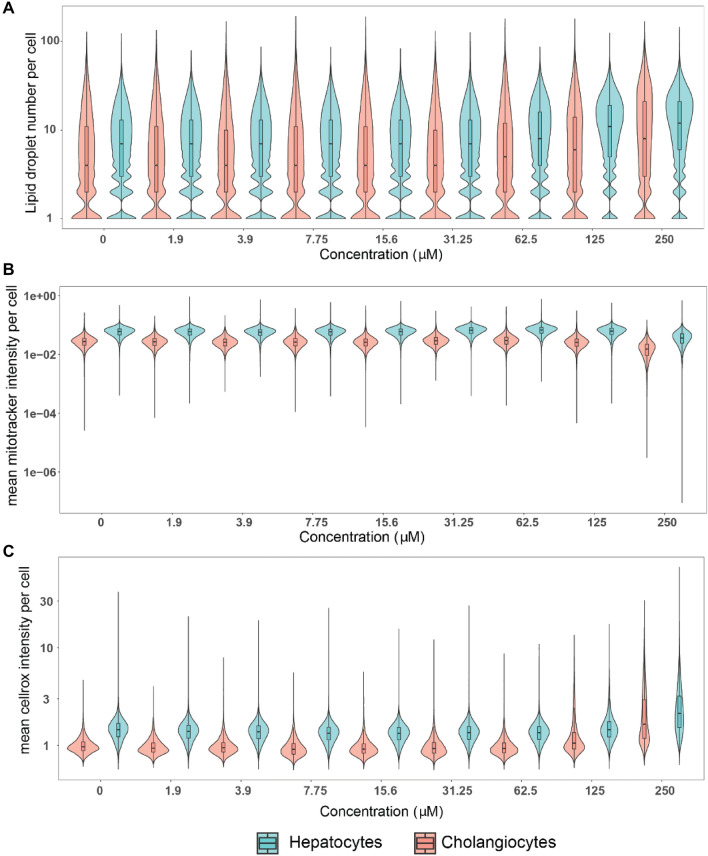
Fig. 5.
Quantification of selected endpoints in individual hepatocytes versus cholangiocyte-like cells after tetracycline exposure. The same raw data used in the population-level analysis were also used for this single cell analysis. 30,000 to 150,000 cells per concentration and cell type were analyzed. Cells from 3 independent experiment were included in the analysis. Notched boxplots were overlaid in the violin plots to display the confidence interval around the median

