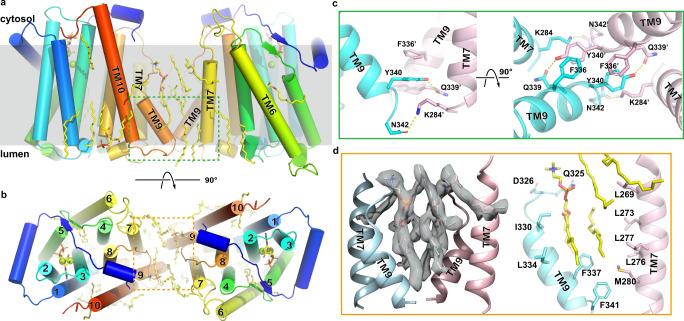
Fig. 4. Dimerization interface.
a–b Dimeric xlCHPT1 structure is shown as cartoon in two orientations, and lipids are shown as yellow sticks. The green and orange boxes mark the region with close-up views shown in c & d. c Residues at the dimer interface. Two monomers are shown in cyan and pink. d Lipids trapped at the dimer interface. Density of lipids is shown as a transparent gray surface, and partially resolved lipid molecules are shown as sticks.

