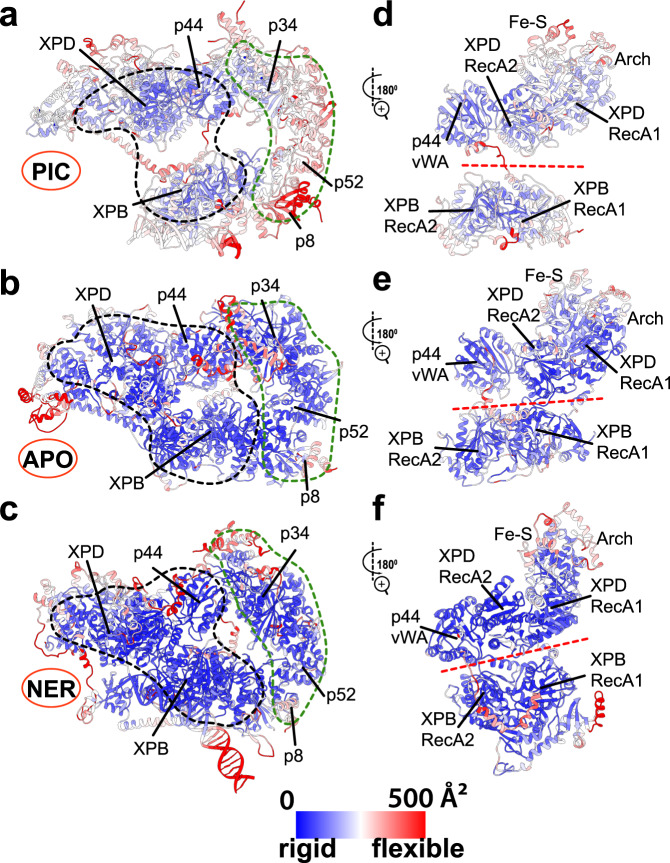
Fig. 3. TFIIH dramatically alters its flexibility and dynamics depending on functional context.
Computed B-factors mapped onto the structural models of a PIC-TFIIH, b apo-TFIIH and c NER-TFIIH. B-factor values are colored from low (blue) to high (red). Close-up views of the rigid (blue) versus flexible (red) structural elements at the XPB–XPD interface in d PIC-TFIIH, e apo-TFIIH and f NER-TFIIH. Black dashed outline highlights an unexpected rigid anchor region formed by p44/XPB and part of XPD in the TFIIH-NER complex. The interface of XPB and XPD is highlighted by a red dashed line. The TFIIH lever arm (p8, p52, p34) is indicated by a green dashed outline.

