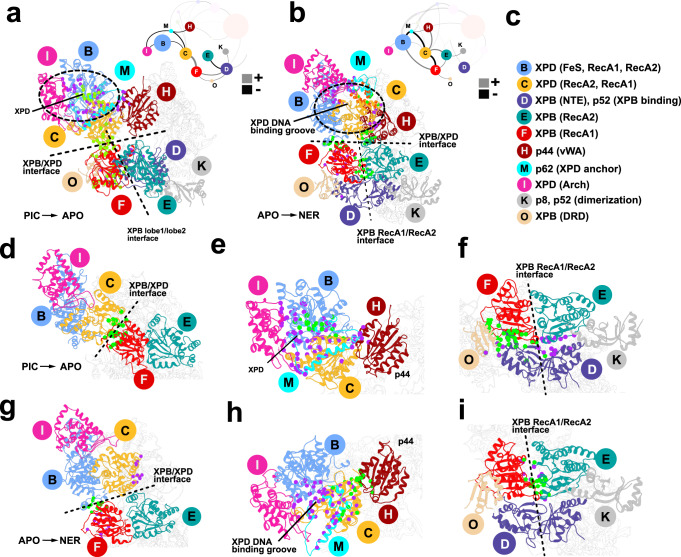
Fig. 5. Network analysis reveals conformational switching at TFIIH community interfaces.
Residues experiencing the largest gain/loss of contact probability during the PIC to apo and apo to NER transitions are mapped onto the TFIIH structure and shown as green or purple dots, respectively. Dynamic communities of XPB, XPD and adjacent subunits are colored as in Fig. 4. TFIIH lever arm communities are shown in gray. dCNA subgraphs for these communities are shown as insets, with gray or black edges indicating gain(+)/loss(-) of dynamic contacts Contact changes are shown for the following transitions: a PIC to apo; b apo to NER. c community identities in the consensus network are indicated; labels denote the principal domains/structural elements belonging to a community. d–f, Close-up views of interfaces with the largest contacts gain (green)/loss (purple) during the PIC to apo transition: d the XPB–XPD interface; e XPD-p44 and XPD-p62 interfaces; f the XPB ATPase domains and the collar region. Close-up views of interfaces with the largest contacts gain (green)/loss (purple) during the apo to NER transition: g the XPB–XPD interface; h the XPD-p44 and XPD-p62 interfaces; i the XPB ATPase domains and the collar region.

