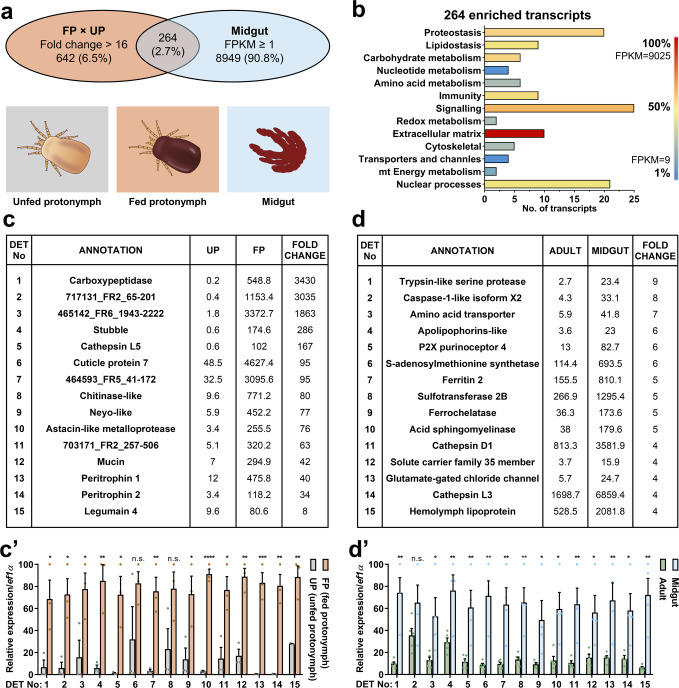
Fig. 2. Comparative transcriptomics, with RT-qPCR validation, to identify blood digestion-associated transcripts.
a Venn diagrams show an overlap of composition with transcripts enriched in fed protonymphs >16× FPKM values over unfed protonymphs and with transcripts of FPKM ≥ 1 in midguts. b The bar graph shows protein classes encoded by individual transcripts enriched by blood-feeding. Transcripts were sorted according to encoded protein class. The number of transcripts from each subclass and their FPKM values are shown. c The table shows top differentially expressed transcripts (DET) enriched, >16× FPKM values, in transcriptomes of blood-fed protonymphs (FP) over transcriptomes of unfed protonymphs (UP). Individual accession IDs are available in Supplementary Table S3. c’ RT-qPCR validation of DETs identified by RNA-seq data shown in panel (c). Data were obtained from cDNA sets synthesised from three independent RNA isolates of unfed and blood-fed mites (n = 3) and normalised to elongation factor 1 (ef1α). Means and SEMs are shown. d The table shows DETs enriched in transcriptomes of midguts over transcriptomes of whole bodies, with filters applied: Eval < e−60, coverage ≥ 90%, FPKMAdults ≥ 2. Individual accession IDs are available in Supplementary Table S4. d’ RT-qPCR validation of DETs identified by RNA-seq data shown in panel (d). Data were obtained from cDNA sets synthesised from at least four independent RNA isolates of adult females and micro-dissected midguts of adult females (n ≥ 4) and normalised to ef1α. Means and SEMs are shown. t-Test analyses: *p = 0.05–0.01; **p = 0.01–0.001; ***p = 0.0008; ****p < 0.0001; n.s. not significant. For the source data behind the graphs, see Supplementary Data S1.

