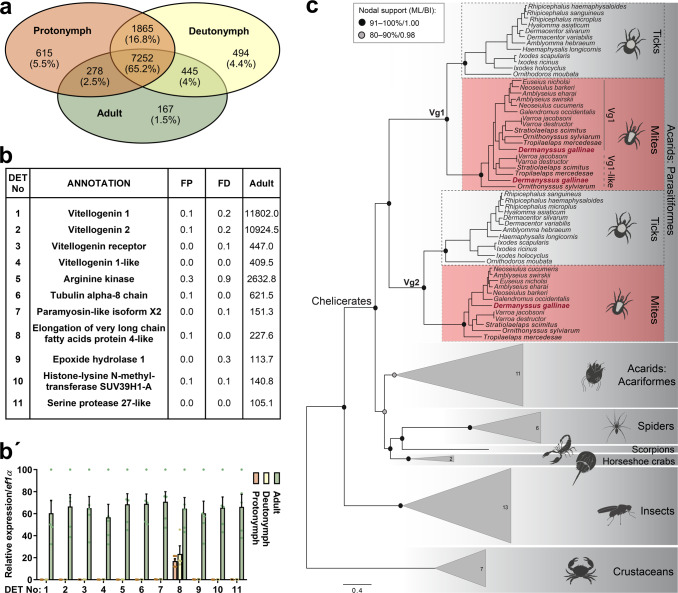
Fig. 5. Enriched transcripts in adult mites and phylogenetic reconstruction of arthropod vitellogenins.
a Venn diagrams show the stage-specific transcriptomic idiosyncracies as well as the transcriptomic core shared across ontogeny. b The table shows the top transcripts enriched in transcriptomes of adult mites. These were filtered by >16× FPKM values in the transcriptome of adults over transcriptomes of both mite juvenile stages, protonymphs and deutonymphs; and E-value < e−80; protein IDs are available as Supplementary Table S7. b’ RT-qPCR validation of DETs identified by RNA-seq data shown in panel (b). Data were obtained from cDNA sets synthesised from three independent RNA isolates of adult and juvenile mites (n = 3) and normalised to elongation factor 1 (ef1α). Means and SEMs are shown. For the source data behind the graph, see Supplementary Data S1. FP fed protonymphs, FD fed deutonymphs. c Maximum likelihood phylogeny of 94 arthropod vitellogenin amino acid sequences showing the positioning of three D. gallinae vitellogenin homologues within the Vg1 and Vg2 lineages. Crustacean vitellogenins were used as an outgroup. Nodal supports at the main nodes are represented by maximum likelihood bootstrap values and Bayesian inference posterior probabilities, respectively. For simplification, the homologues from non-parasitiform taxa were collapsed into triangles; numbers inside the triangle indicate the number of sequences included in each clade. For GenBank accession numbers, see Supplementary Table S8.

