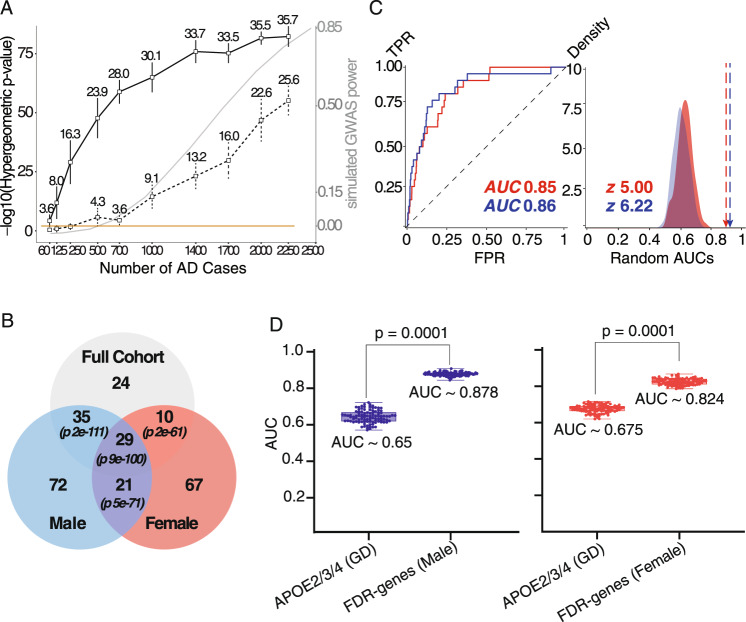
Fig. 3. Down-sampling analyses and sex-separated analysis led to better risk prediction.
A Down-sampling analyses, x: The number of randomly selected samples of AD cases; an equal number of control samples were also randomly selected. y: Hypergeometric P-values (one-tailed Fisher’s Exact test) comparing the top 50 genes from each iterated experiment to the top 50 genes from full cohort, solid-line: EAML, dot-line: SKAT-O; numbers indicates mean number of overlapped genes between each set and full cohort ADSP, the error bar indicates standard error for the mean number of overlapped genes; gray-line indicates simulated GWAS power using GWAS power calculator. B Venn-diagrams intersection between top EAML predicted genes from full cohort, male, and female. The number indicates the number of overlap genes between each EAML analysis. The hypergeometric p-value (one-tailed Fisher’s Exact test) was calculated using SuperExactTest R package156. C Diffusions from the top 157 genes from male (blue) and the top 127 genes from female (red) to the 25 GWAS genes. D Risk predictions that based on the EAML genes for male (blue), female (red). EAML significantly (p ~ 0.0001) improved prediction AUC comparing to APOE in male and female combined. When separating sexes, male’s genes significantly better predict than the combined (AUC 0.878 vs. 0.825) although female genes’ prediction AUC stay same (AUC 0.824 vs. 0.825). (*GD: APOE alleles + Age). The box plot indicates minimum and maximum (lower and upper) whiskers, median (horizontal line), and first and third quartile (box). The mean AUCs of two groups (APOE vs. 98 FDR genes) and p-value of standard t-test (two sided) are shown.

