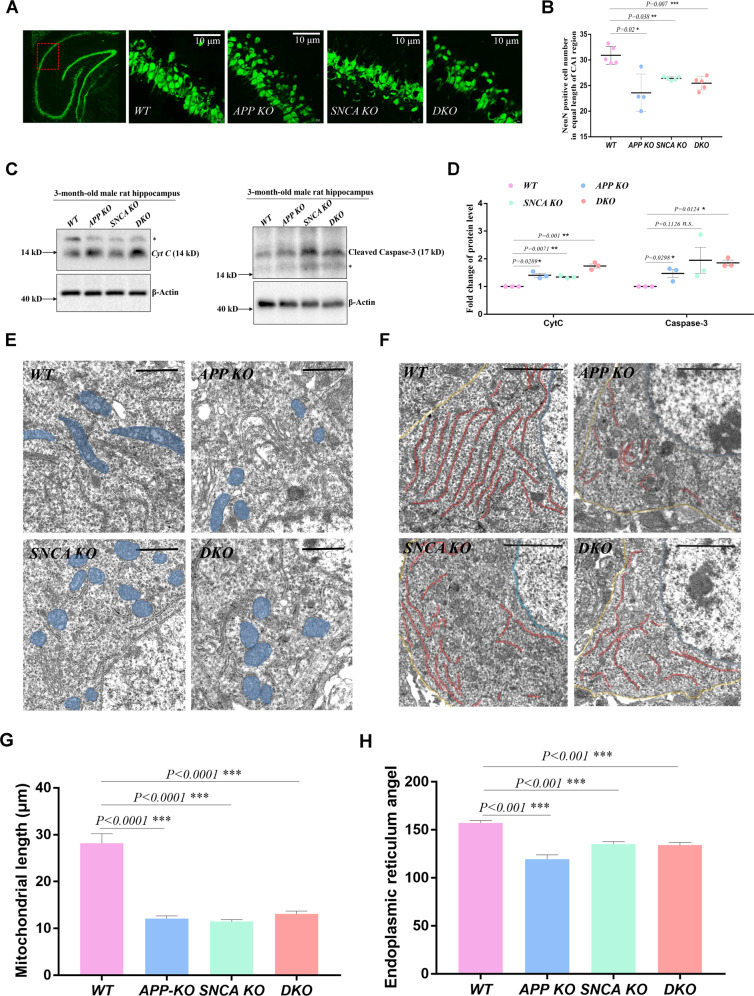
Fig. 2. APP and SNCA deficiency lead to hippocampal degeneration.
A, B Immunostaining of brain slices performed with a NeuN antibody. Coronal slices from each rat were prepared to include the bilateral hippocampus. Two slices per rat were used for NeuN immunostaining. Under 60× objective vision, a complete field of two red squares (indicated by the red box) in the CA1 region of the unilateral hippocampus was photographed, and the NeuN-positive neurons in each field were counted. Eight fields from each rat were assayed, and the average value of an individual rat is indicated by a single dot in (B). Three independent experiments with WT (n = 5), APP KO (n = 4), SNCA KO (n = 5) and DKO (n = 5) rats were executed with 3-month-old male rats. The data of individual rats are shown as the mean ± SEM. T-tests were performed. *p < 0.05, **p < 0.01, and ***p < 0.001 indicate significant differences. C, D Western blotting of Cyt C and cleaved Caspase-3 in the rat hippocampi of the indicated genotypes. The stray band is indicated by the asterisk. A single rat per genotype was detected in one experiment, as shown in (C). Three independent experiments of three 3-month-old male rats per genotype were performed. The data are presented as the mean ± SEM in (D) with the dots indicating data from individual rats. T-tests were performed. *p < 0.05 and **p < 0.01 indicate significant differences, and n.s. indicates no significance. E, F Representative TEM images of pyramidal neurons in hippocampal slices from 3-month-old male rats. Mitochondria and the ER network in the neuronal soma are shaded blue and red, respectively. The yellow lines indicate the PM, and the blue lines indicate the nuclear envelope in the neuronal soma in (F). Scale bar = 10 μm in (E) and 20 μm in (F). G Mitochondrial morphology assay. The length between the longest two ends of each mitochondrial particle in TEM photos was measured. The data are presented as the mean ± SEM with at least five photos of each genotype. T-tests were used. ***p < 0.001 indicates a significant difference. H ER morphology assay. The bending angle of the ER lamella was measured in TEM photos. The data are presented as the mean ± SEM with at least five photos of each genotype. T-tests were used. ***p < 0.001 indicates a significant difference.

