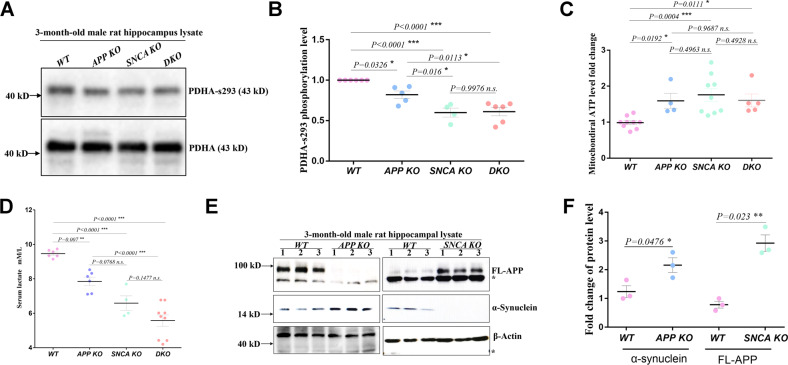
Fig. 4. MAM-located APP and α-synuclein maintain ER-mitochondrial calcium homeostasis.
A, B Western blot analysis of PDHAs293 (PDH phosphorylated at Ser293 of the E1-α subunit) and total PDHA protein levels in hippocampal lysates from rats of the indicated genotype. Three independent experiments of (A) with at least four male rats of 3-months old per genotype were used for quantification. The PDHAs293/PDHA level of individual rats is indicated by a dot in (B). The mean ± SEM for each genotype is presented, including WT (n = 6), APP KO (n = 5), SNCA KO (n = 4) and DKO (n = 6). One-way ANOVA was used for statistical analysis, and differences are indicated by asterisks. *p < 0.05 and ***p < 0.001 indicate significant differences, and n.s. indicates no significance. C ATP levels in mitochondria isolated from the rat hippocampi of the indicated genotype. At least four male rats of 3-month-old per genotype were studied in three independent experiments. The data of individual rats are indicated by dots, and the mean ± SEM for each genotype is presented. One-way ANOVA was used for statistical analysis, and differences are indicated by asterisks. *p < 0.05 and ***p < 0.001 indicate significant differences, and n.s. indicates no significance. D Serum lactate levels of rats with the indicated genotype. At least four male rats of 3-month-old per genotype were assayed. The data of individual rats are indicated by dots, and the mean ± SEM for each genotype is presented. One-way ANOVA was used for statistical analysis, and differences are indicated by asterisks **p < 0.01 and ***p < 0.001 indicate significant differences, and n.s. indicates no significance. E, F The protein levels of FL-APP and α-synuclein in the hippocampi of 3-month-old male knockout rats were measured in SNCA KO and APP KO rats by western blotting in (E). Tissue samples were collected from three rats of each genotype. The asterisk indicates a stray band. Quantification is shown in (F) with the mean ± SEM, and each dot represents the data from an individual rat. T-tests were used. *p < 0.05 and ***p < 0.001 indicate significant differences.

