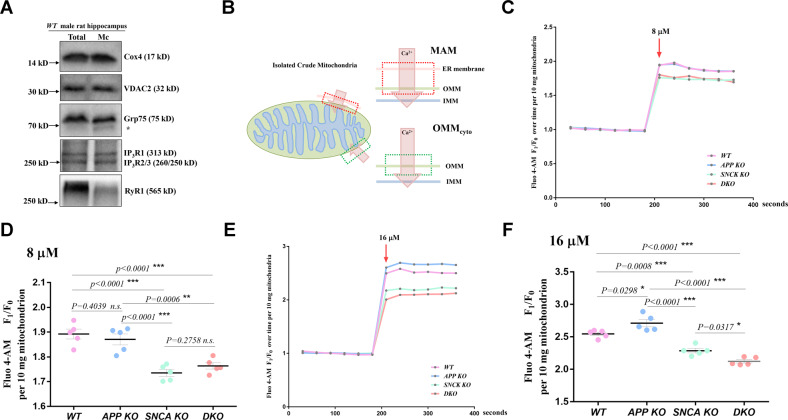
Fig. 5. APP and α-synuclein cooperatively control MAM calcium flow.
A The calcium channels in the crude mitochondrial fraction isolated from the hippocampi of male WT rats were measured by western blotting. Total total homogenate, Mc crude mitochondria. The molecular weight of each protein is provided on the right. The stray band is indicated by an asterisk. B Diagram of the two calcium flow paths into isolated crude mitochondria. The arrows indicate the direction of calcium flux. The red box indicates calcium flow through the MAM. The green box indicates calcium flow through the OMMcyto. Calcium flowing into the mitochondrial matrix through the MAM needs to pass through three layers, including the ER membrane, OMM and inner mitochondrial membrane (IMM), while calcium flowing through the OMMcyto needs to cross only two layers, the OMM and IMM. A higher concentration of calcium should flow through the MAM than through the OMMcyto because the calcium concentration in the ER lumen is usually 1000 times higher than that in the cytoplasm [28]. C Representative fluorescence traces showing mitochondrial calcium uptake after 8 μM calcium stimulation. Ten milligrams of isolated crude hippocampal mitochondria from 3-month-old male rats were loaded with Fluo 4-AM and used for the assay. The fluorescence was measured 6 times every 30 s before and after stimulation buffer was added. The average mitochondrial fluorescence count before stimulation was used as an internal reference (F0). The fluorescence fold change relative to F0 (F1/F0) was used for normalization to assess calcium uptake. The F1/F0 value is plotted on the y-axis, and the detection time is plotted on the x-axis. The red arrow indicates the addition of 8 μM CaCl2 buffer for stimulation. D Three independent experiments including at least five rats per genotype were performed as described in (C). The average F1/F0 values after 8 μM calcium stimulation of hippocampal mitochondria from individual rats are indicated by dots. The mean ± SEM for each genotype is presented. One-way ANOVA was used for statistical analysis, and differences are indicated by asterisks. **p < 0.01 and ***p < 0.001 indicate significant differences, and n.s. indicates no significance. E, F Similar experiments were performed with 16 μM calcium stimulation. Representative fluorescence traces are shown in (E), and quantitative data for the four genotypes are presented in (F). The F1/F0 values of individual rats are indicated by dots. The mean ± SEM for each genotype is presented. One-way ANOVA was used for statistical analysis, and differences are indicated by asterisks. *p < 0.05 and ***p < 0.001 indicate significant differences.

