
Fig. 2.
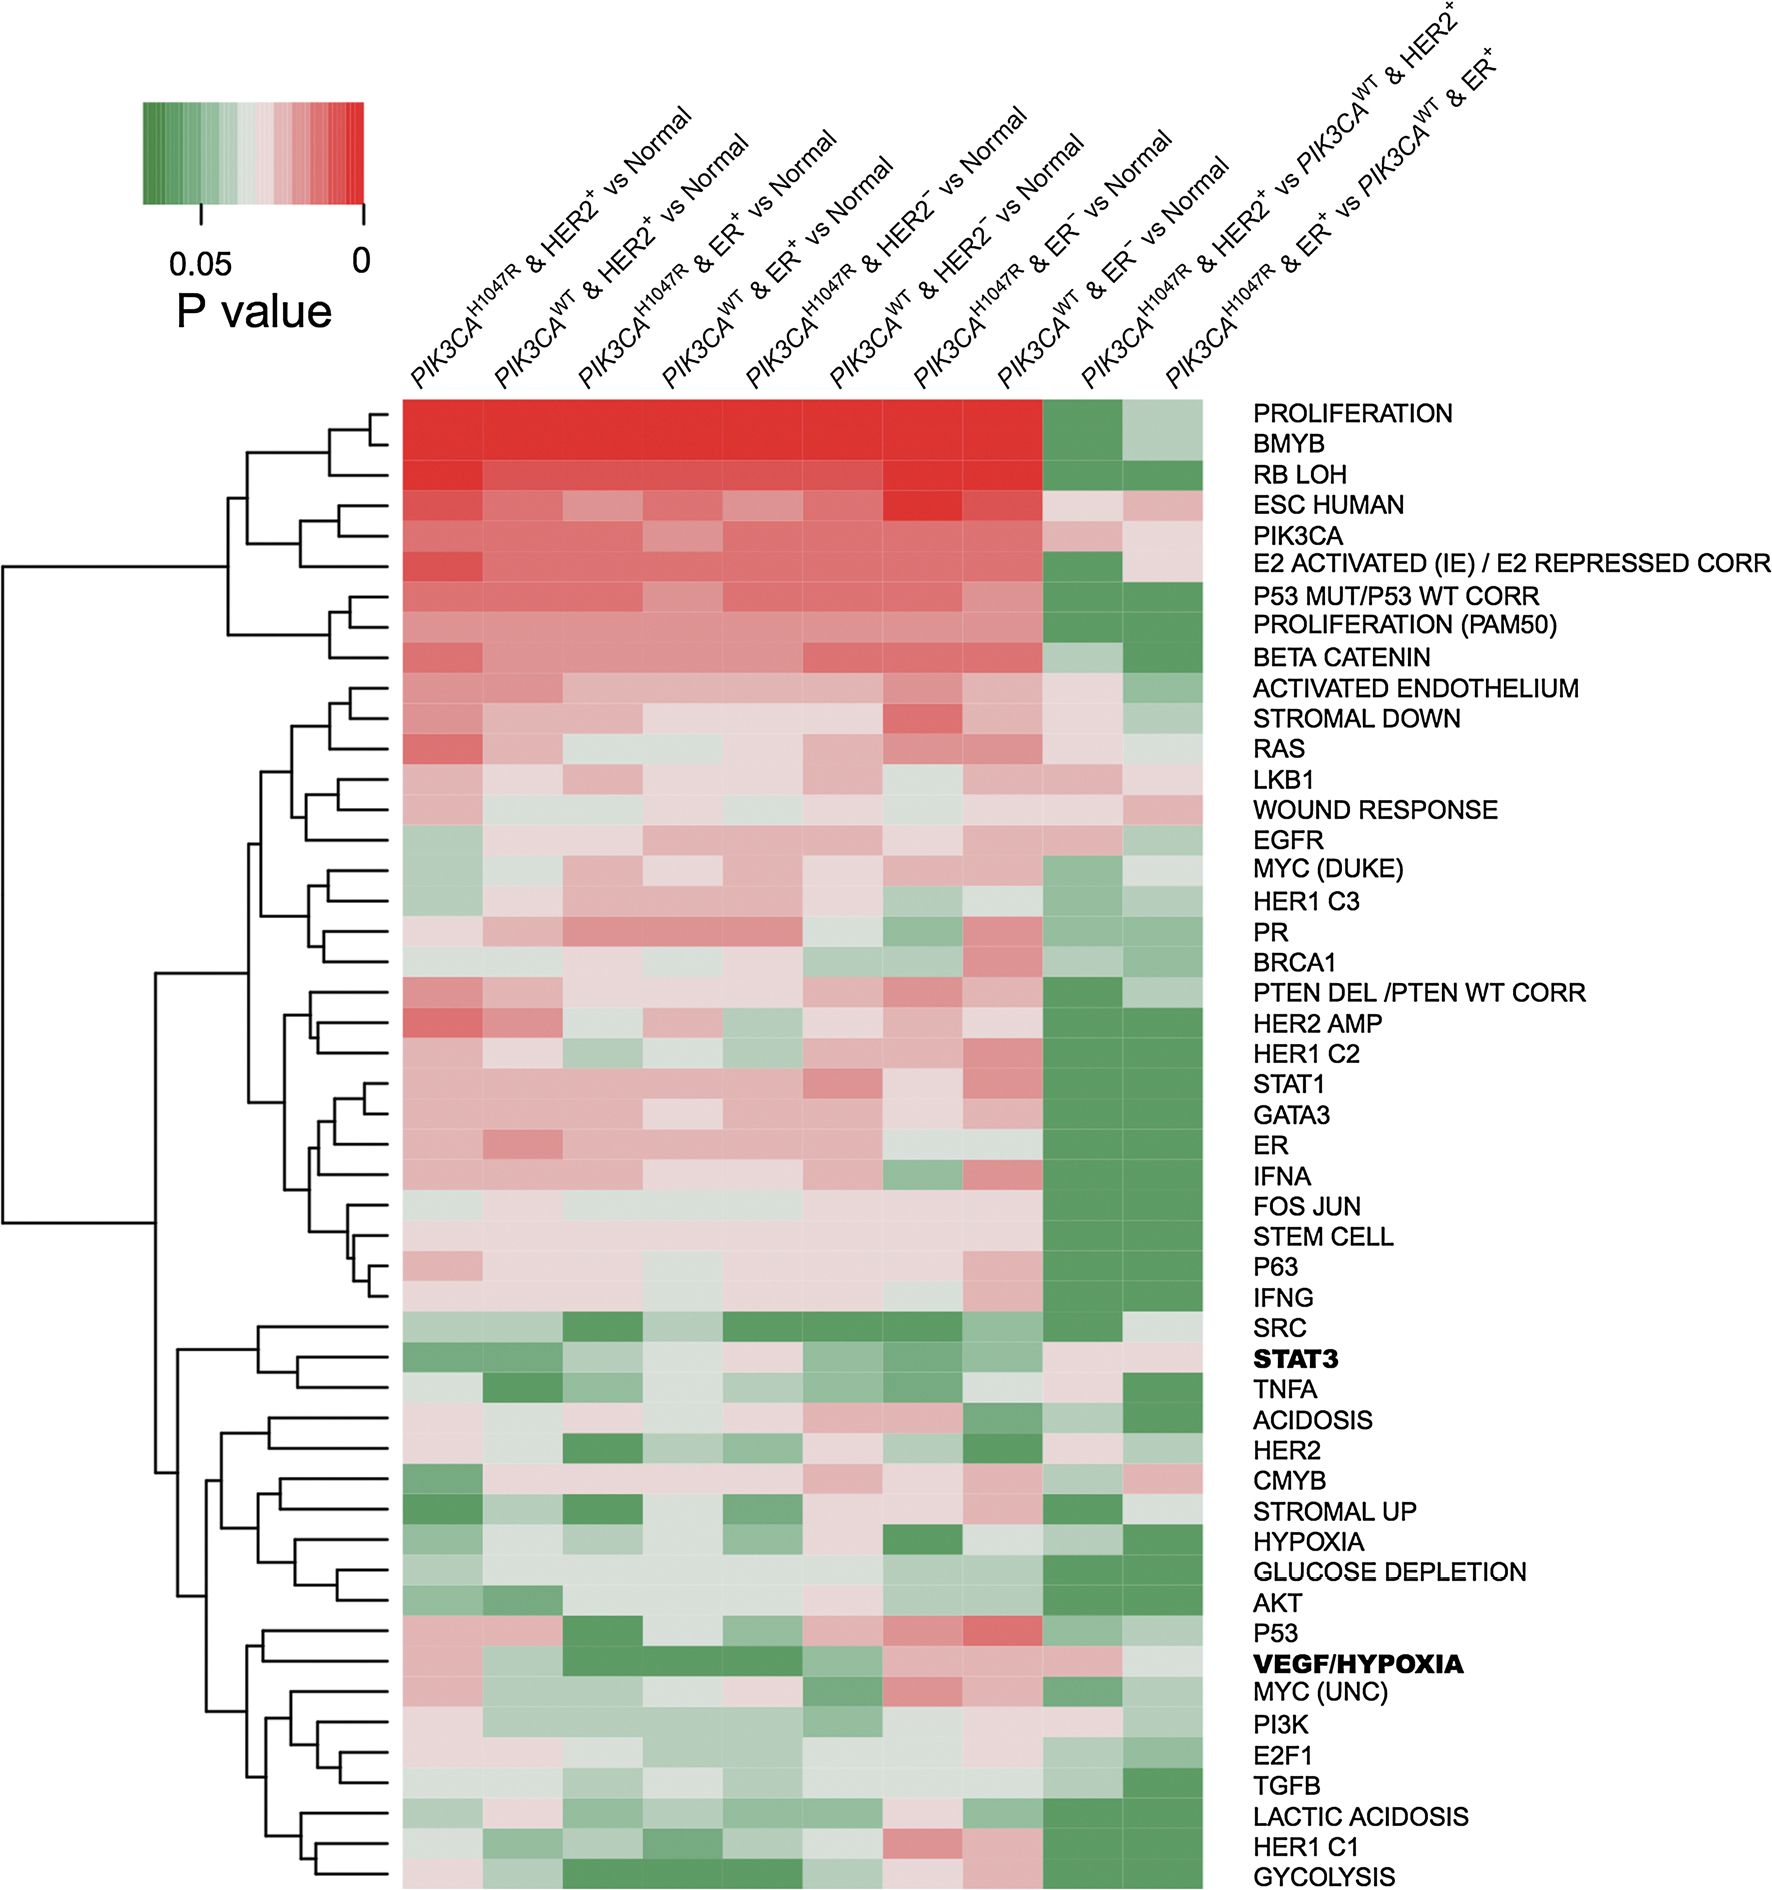
Heat map showing oncogenic pathways altered by PIK3CAH1047R across 10 different subgroups of breast cancer. A panel of 52 well-annotated gene signatures representing the main oncogenic pathways in breast cancer was collected from a previous study [34]. The P value indicates the statistical significance of enrichment analysis for the up-regulated genes (Supplementary Table 1) in each subgroup of breast cancer compared to normal breast tissues across 52 well-annotated gene signatures (Supplementary Table 2) using Fisher’s exact test. Gene differential expression analysis was performed based on the breast invasive carcinoma dataset (RNA-seq, read count) from TCGA. The significantly up-regulated genes by cutoff: log2(FC) < 1 and adjusted P value > 0.01 were used for 52 well-annotated gene signature enrichment analyses. Two interesting pathways, VEGF/Hypoxia and STAT3, were highlighted in bold at the right side and discussed in main text