
Fig. 3.
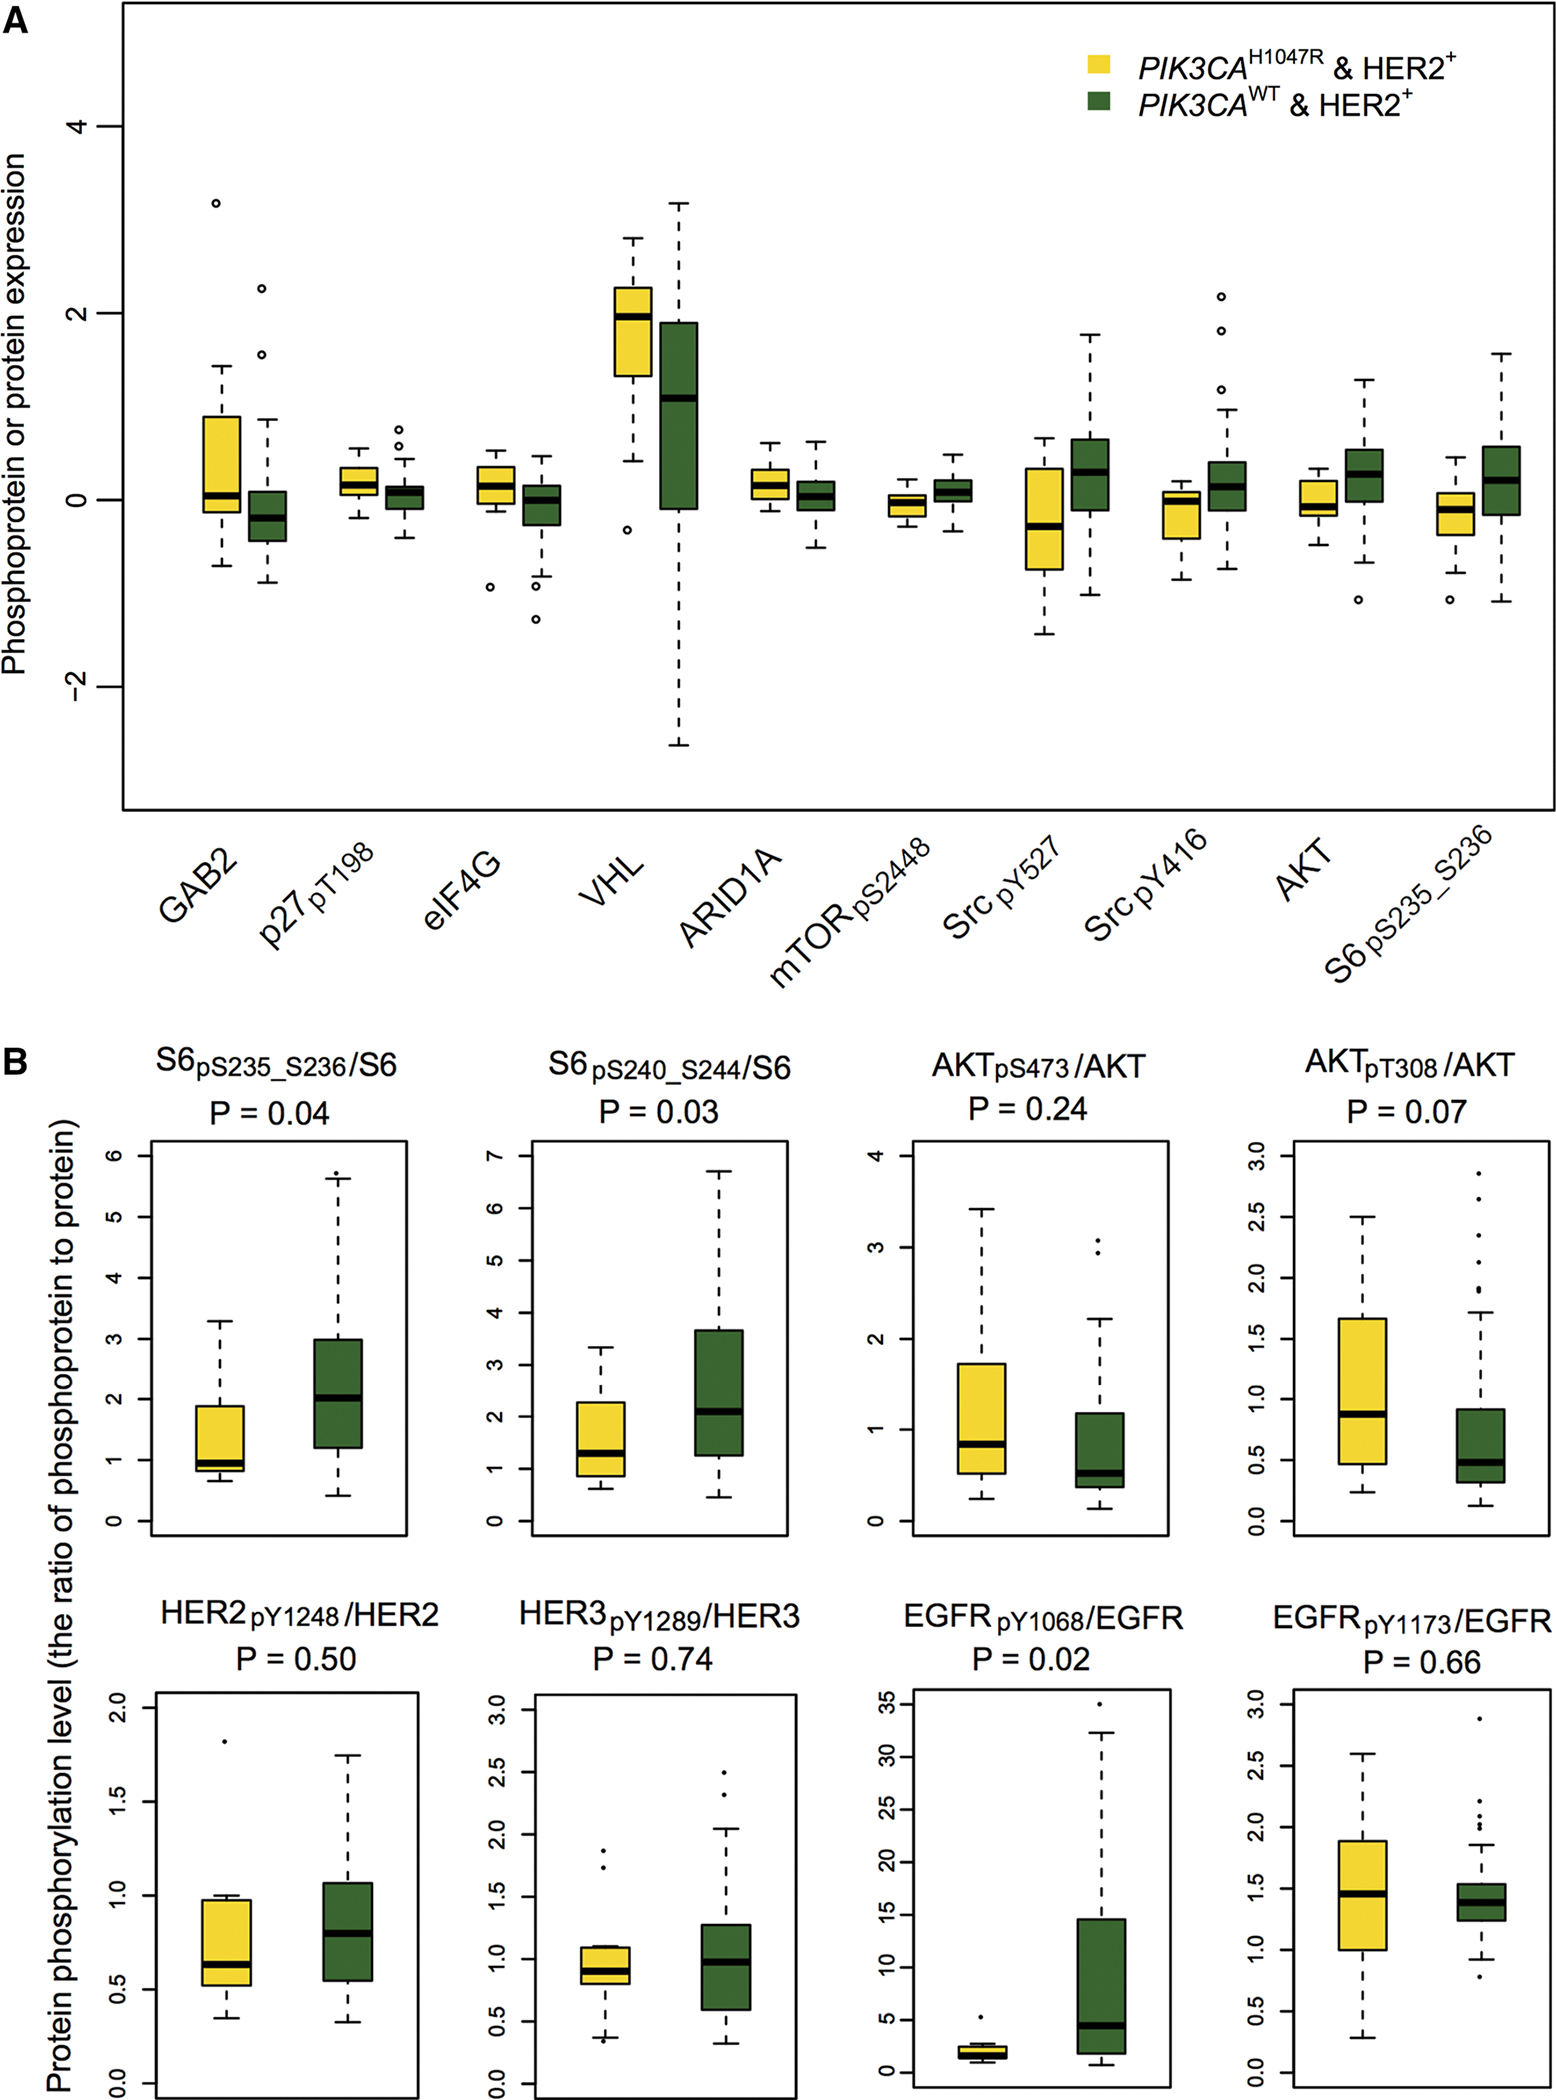
Box plots showing the representative differential proteins or phosphoproteins in HER2+PIK3CAH1047R versus HER2+PIK3CAWT subgroups. a Top 5 up-regulated and down-regulated proteins or phosphoproteins (y-axis by protein expression) in HER2+ PIK3CAH1047R patients versus HER2+PIK3CAWT subgroup. b Box plot view showing the ratio of phosphoprotein to total protein level for 5 example proteins (S6, AKT, EGFR, HER2, and HER3) altered by PIK3CAH1047R in HER2+ breast cancer. Protein or phosphoprotein differential analyses in this figure and Fig. 4 were performed based on the normalized RPPA protein expression data collected from TCPA [21]. The phosphorylation sites in phosphoprotein were labeled by subscript text. The P values were calculated by Wilcoxon rank-sum test. The detailed data are provided in Supplementary Table 3