
Fig. 4.
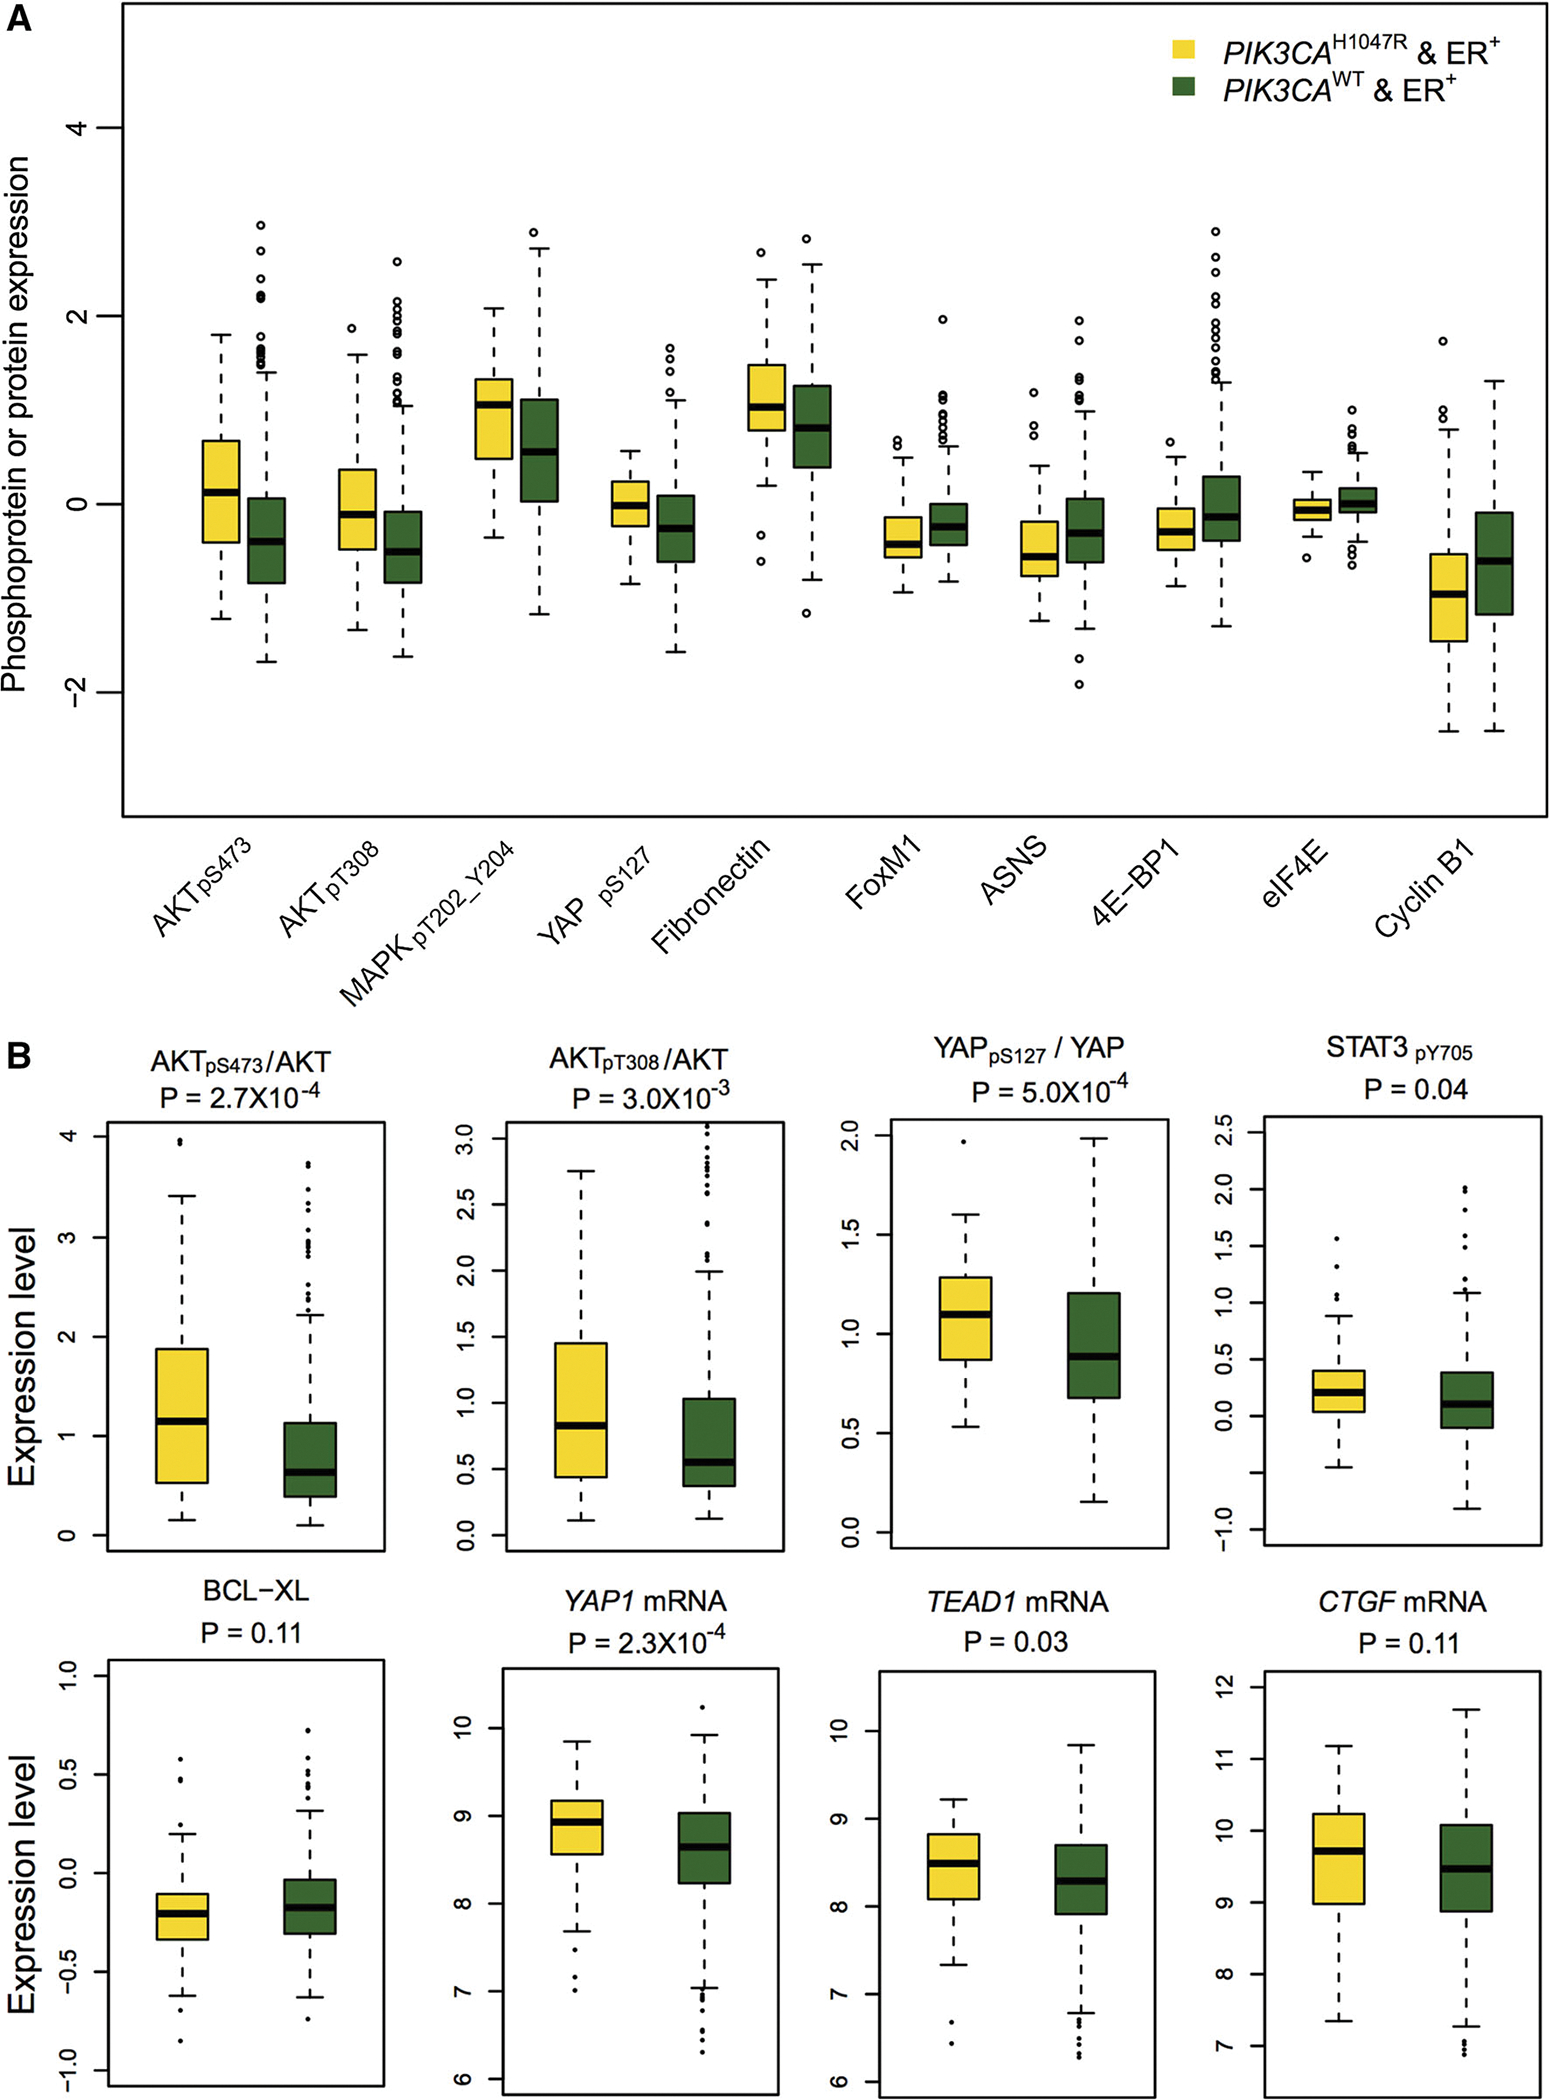
Box plots showing the representative differential proteins in ER+PIK3CAH1047R versus ER+PIK3CAWT subgroups. a The top 5 upregulated and down-regulated proteins or phosphoproteins (y-axis by protein expression) in ER+PIK3CAH1047R patients versus ER+ PIK3CAWT subgroup, respectively. b Box plot view showing the ratio of phosphoprotein to total protein level for 2 representative proteins (AKT and YAP), phosphoprotein (STAT3) and protein (BCL-XL) differential expression, and mRNA differential expression for YAP1 and two YAP1 target genes (TEAD1 and CTGF) altered by PIK3CAH1047R in ER+ breast cancer. The phosphorylation sites in phosphoprotein were labeled by subscript text. The P values were calculated by Wilcoxon rank-sum test for protein differential expression analysis and by edgeR software for mRNA differential expression analysis. The detailed data are provided in Supplementary Table 3