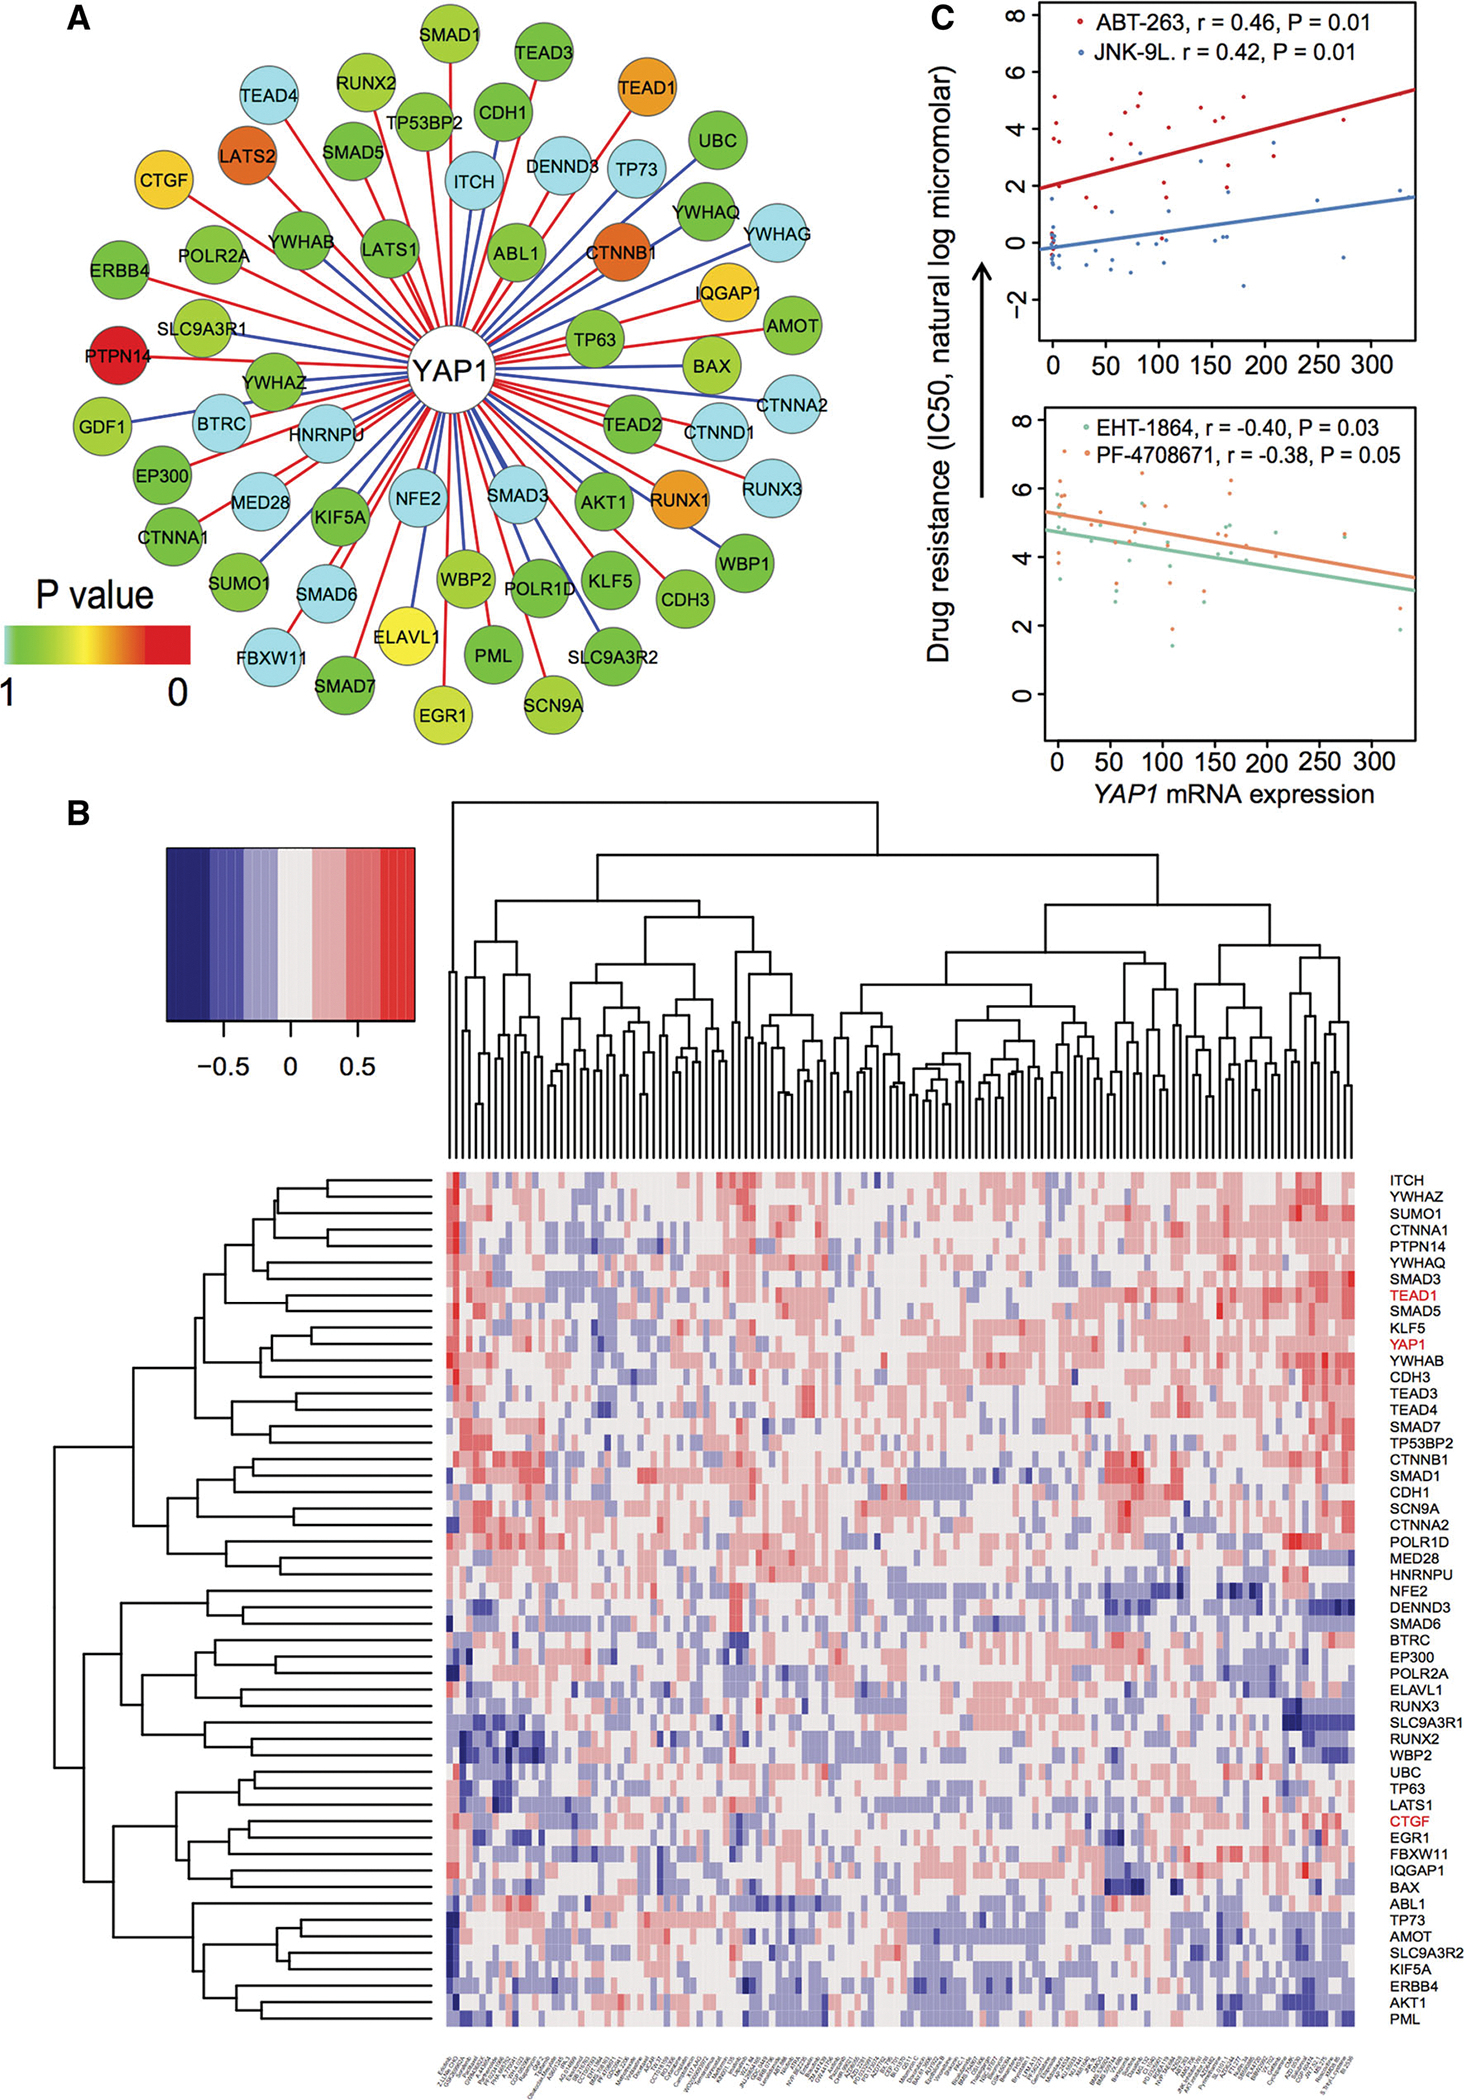
Fig. 5.

A gene co-expression-weighted protein interaction subnetwork for YAP1 and the relationship between mRNA expression and drug responses in breast cancer cell lines based on the GDSC dataset [55]. a A gene co-expression-weighted protein interaction subnetwork connecting YAP1 and its 58 interacting proteins. The red edges denote positive co-expression and blue edges denote negative co-expression. The different color keys on nodes represent significance (P values) of gene co-expression measured by F statistics. Gene co-expression analysis was performed based on ER+PIK3CAH1047R breast invasive carcinoma dataset (RNA-seq with V2 RSEM) from TCGA. b Heat map showing the Pearson correlation coefficient (color key) between drug responses and gene mRNA expression for YAP1 and its 58 interacting genes based on the GDSC dataset [55] including 130 drugs’ response data (IC50, the natural log micromolar) and microarray expression across 53 breast cancer cell lines. The labels at the right side are genes and in the bottom are drugs. YAP1 and its two important target genes (TEAD1 and CTGF) were highlighted by red. c Four significant correlation (r: Pearson correlation coefficient) pairs between YAP1 mRNA expression and drug resistance. The P values were performed by F statistics
