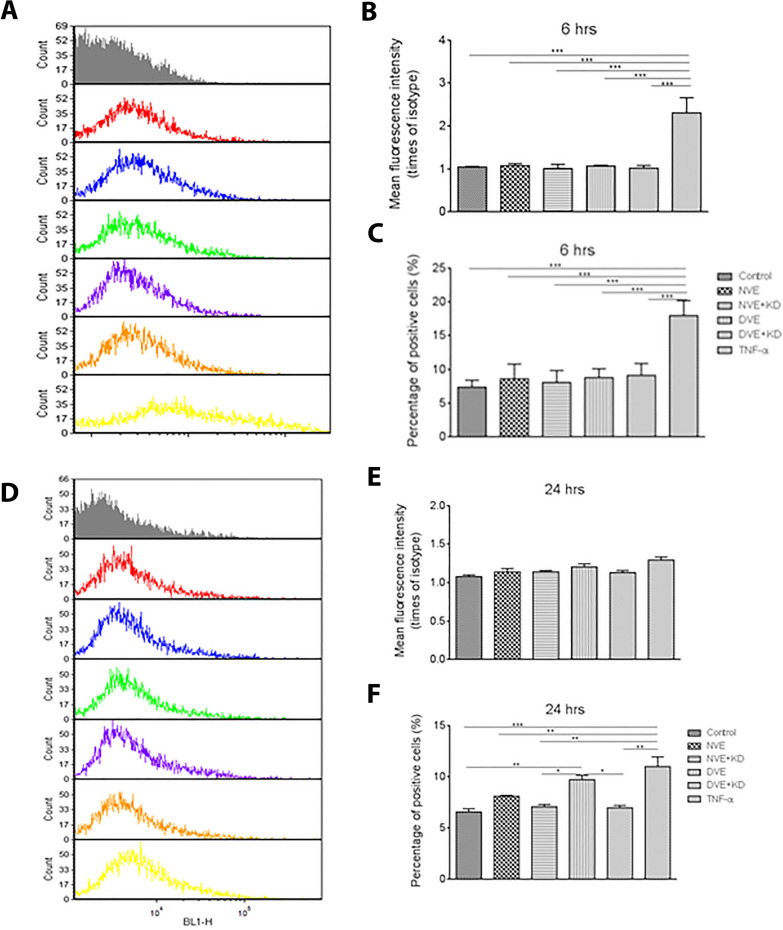
Fig. 5.
Exposure of HCAECs to DVEs promotes increased surface expression of ICAM-1. A Histograms of cell surface expression of ICAM-1 expression following 6 h of treatment. B Fluorescence intensity of ICAM-1 antibody relative to the isotype control (mean ± SEM, n = 3). C Percentage of HCAECs with positive expression of ICAM-1 (mean ± SEM, n = 3). D Histograms of cell surface expression of ICAM-1 expression following 24 h of treatment. E Fluorescence intensity of ICAM-1 antibody relative to the isotype control following 24 h of treatment (mean ± SEM, n = 3). F Percentage of HCAECs with positive expression of ICAM-1 following 24 h of treatment (mean ± SEM, n = 3). *p < 0.05, **p < 0.01, ***p < 0.001

