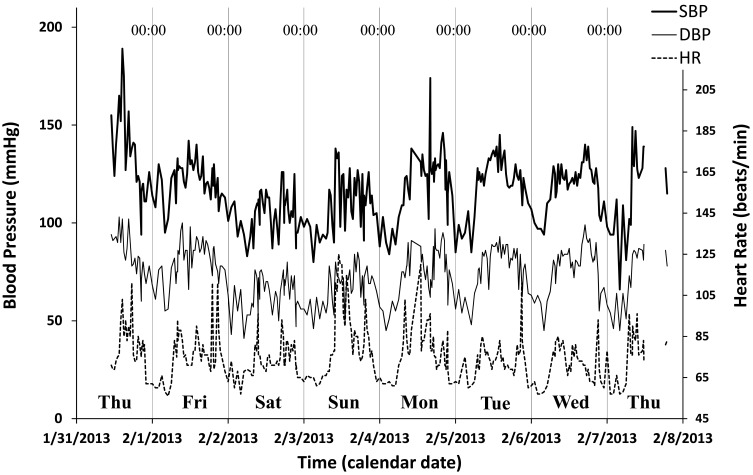
Figure 1.
Example of 7-day/24-hour ABPM. Time plots of the 7-day/24-hour records of systolic blood pressure (SBP, thick continuous line), diastolic blood pressure (DBP, thin continuous line), and heart rate (HR, dashed line) of a 40-year old man with white-coat hypertension. When the 7-day/24-hour ABPM was started at 11:00 in front of a doctor, high SBP on the first day of monitoring can readily be seen. Measurements dropped thereafter within the normal range, where they fluctuated periodically, following a circadian rhythm, suggesting a regular rest-activity schedule.

