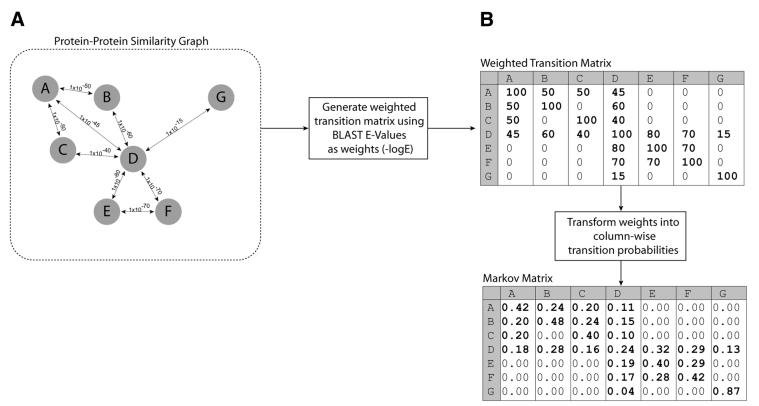
Figure 2.
(A) Example of a protein–protein similarity graph for seven proteins (A–F), circles represent proteins (nodes) and lines (edges) represent detected BLASTp similarities with E-values (also shown). (B) Weighted transition matrix and associated column stochastic Markov matrix for the seven proteins shown in (A). For explanations, please see text.

