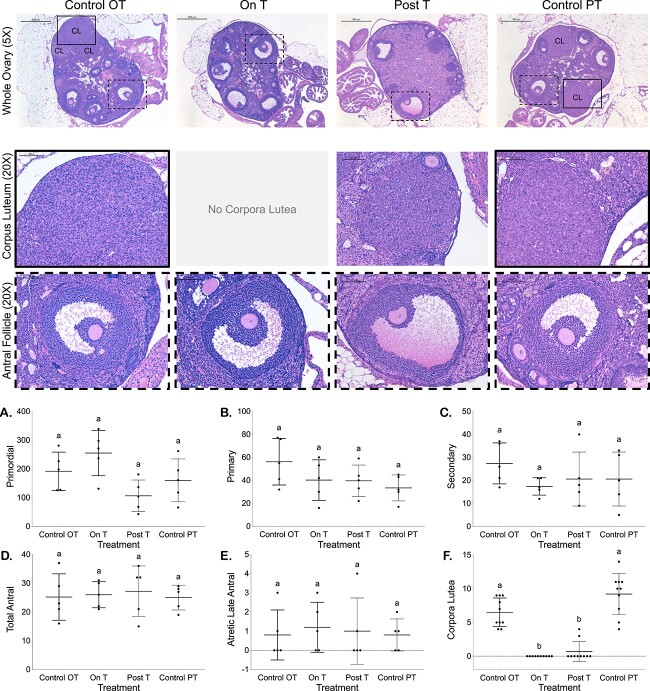
Figure 2.
Reduced corpora lutea On T and Post-T with otherwise comparable follicular distributions. Images of hematoxylin and eosin-stained ovaries from all four groups (Control OT, On T, Post-T, and Control PT). Row 1 includes a representative hematoxylin and eosin-stained ovary (5×, scale 500 μm) from each group, while row 2 highlights example corpora lutea (20×, solid outline corresponding to location in 5× image, scale 100 μm), and row 3 highlights example antral follicles (20×, dashed outline corresponding to location in 5× image, scale 100 μm). Follicle counts from every 10th section for primordial (A), primary (B), and secondary (C) follicles. Follicle counts based on 5× images of every 10th section for total antral (D) and atretic late antral (E) follicles as well as corpora lutea (F).

