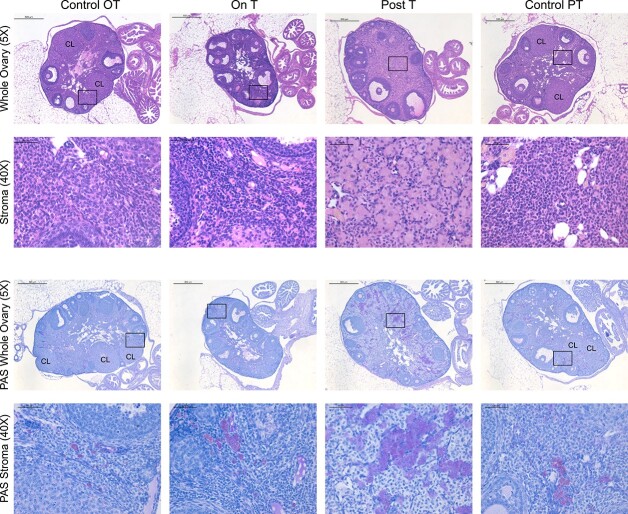
Figure 3.
Ovarian stromal changes Post-T. Columns correspond to the four groups: Control OT, On T, Post-T, and Control PT. Row 1 includes a representative hematoxylin and eosin-stained ovary (5×, scale 500 μm) from each group, with the corresponding magnified view of the ovarian stroma in row 2 (40×, scale 50 μm). Row 3 includes a representative magenta periodic acid–Schiff-stained ovary (5×, scale 500 μm) from each group with blue hematoxylin counterstain, with the corresponding magnified view of the ovarian stroma in row 4 (40×, scale 50 μm).

