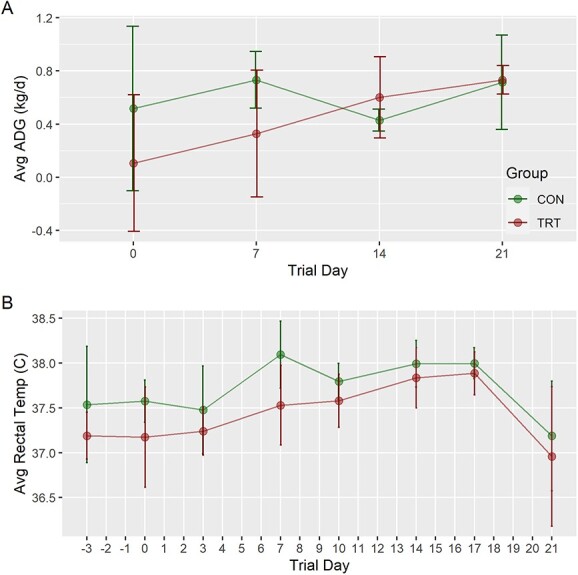
Figure 2.

ADG and average rectal temperature of late gestation pregnant gilts over time. (A) Mean values of the ADG of late gestation pregnant gilts expressed as kg/day by treatment group (n = 4/group). Calculated by body weights measured at trial days −3, 0, 7, 14, and 21. (B) Mean values of rectal temperatures, measured in Celsius, of gilts by treatment group. Measurements were taken biweekly on trial days −3, 0, 3, 7, 10, 14, 17, and 21. Data are presented as line plots with standard error bars. Unique superscripts would signify statistical differences (P < 0.05) between groups at any a time point. Absence of superscripts denotes no significant difference was detected between groups at the designated time point.
