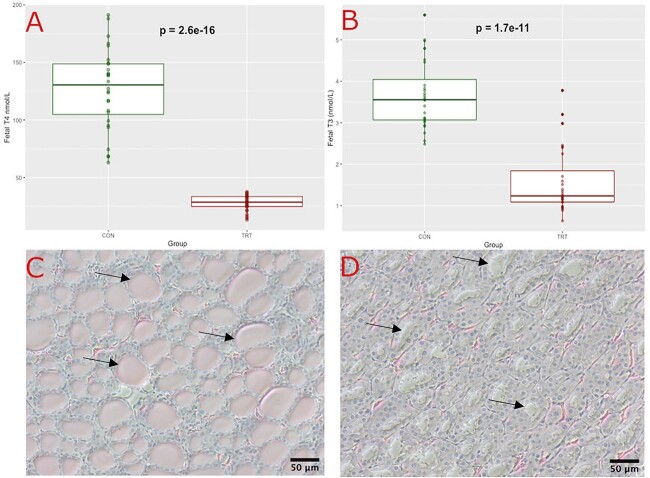
Figure 4.
Thyroid hormone levels and thyroid histology from fetuses at trial day 21. Fetal (A) total T4 and (B) total T3 was measured via ELISA using fetal serum collected on trial day 21 and expressed in SI unit (nmol/L). Data are presented as individual data points as a boxplot of control (CON n = 28) and treated (TRT n = 28) groups. Statistical differences between groups is denoted by P < 0.05. Hematoxylin and eosin staining of the thyroid gland in fetuses from (C) control and (D) treated gilts, both imaged using a 20× objective (scale bar = 50 μm), arrows indicate a selection of thyroid follicles with (C) and without (D) eosinophilic colloid.

