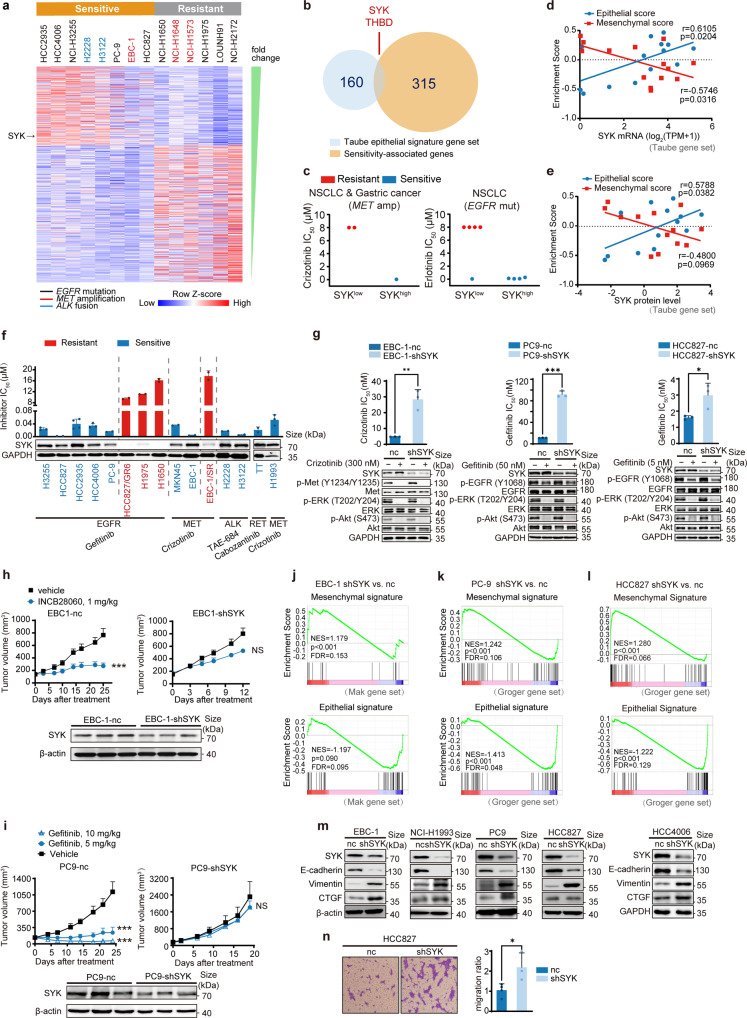
Fig. 1.
High SYK expression, which maintains the epithelial state, is associated with the sensitivity to kinase inhibitors. a Heatmap showing normalized mRNA expression of significantly differentially expressed genes (p < 0.02, log2 (fold change) >2 and FDR < 0.25) in 14 kinase-addicted cancer cell lines classified as sensitive or resistant (as determined by IC50) to specific kinase inhibitors. b Venn diagram illustrating the overlap of epithelial signature genes (Taube gene set) with the significant sensitivity-associated genes indicated in Fig. 1a. c The association between SYK expression and the response to the indicated kinase inhibitor. The median value of mRNA expression was used as the cutoff for the classification of high and low SYK expression. d, e Pearson correlation analysis between epithelial/mesenchymal (E/M) enrichment scores and SYK mRNA (d) and protein levels (e) in the cell lines indicated in Fig. 1a. Panel e does not display the NCI-H3122 cell line data since SYK protein level data for NCI-H3122 cells are not available in the CCLE. f Cell sensitivity to the indicated kinase inhibitors was stratified according to SYK expression in various cancer cells harboring different genetic aberrations. These cell lines included 13 NSCLC cell lines, 1 MET-amplified gastric cancer cell line (MKN45) and 1 RET-mutant thyroid carcinoma cell line (TT) to represent the typical molecular alterations of NSCLC. Detailed information on these cancer cell lines is listed in Supplementary Table S2. Semiquantification of SYK relative to GAPDH and further normalization relative to EBC-1 is shown. g The change in cell sensitivity upon stable SYK knockdown. h The change in the response to INCB28060 in EBC-1 xenograft-bearing mice upon stable SYK knockdown (n = 6/group in EBC-1-shSYK model, n = 7/group in EBC-1-nc model). i The change in the response to gefitinib in PC9 xenograft-bearing mice upon stable SYK knockdown (n = 6 for each group). j to l GSEA of stable SYK knockdown versus negative control EBC-1 (j), PC-9 (k) and HCC827 (l) cells. The gene sets shown are indicated as epithelial or mesenchymal state-associated genes. FDR, false discovery rate. NES, normalized enrichment score. m Immunoblotting analysis of representative E/M signatures in cell lines upon stable SYK knockdown. n The change in cell migration upon stable SYK knockdown. The data shown are representative results from three independent experiments in g, m, n, and from two to four independent experiments in f. The data in f, g and n are presented as the mean ± SD; the data in h, i are presented as the mean ± SEM. ***p < 0.001, **p < 0.01, and *p < 0.05 using Student’s t test in g, h and n, or one-way ANOVA in i

