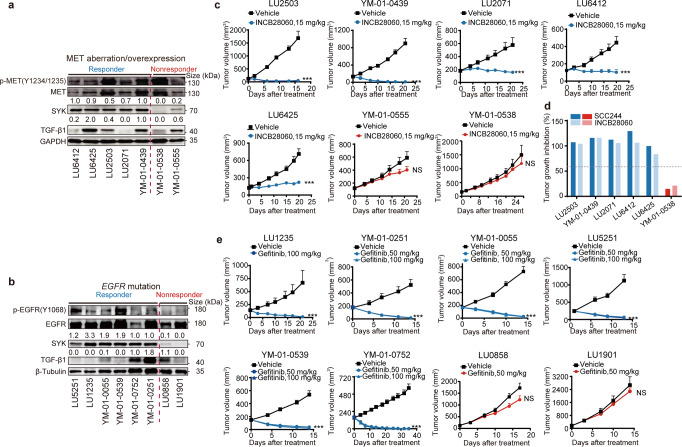
Fig. 4.
SYK-high status indicates a therapeutic response to c-Metis and EGFRis in NSCLC PDX models. a and b Intratumoral expression of SYK and TGF-β1 in 15 primary lung cancer PDX models harboring c-Met (a) and EGFR (b) aberrations prior to treatment. Detailed information on these PDX models is listed in Supplementary Table S4. The expression level was semiquantified and normalized to that of the GAPDH control. The values above the immunoblots indicate the SYK and TGF-β1 levels in each model relative to those in the LU-01-0439 (c-Met panel) and LU-01-0752 (EGFR panel) models. SYK values ≥ 1.0 and 0.5 were defined as high, while SYK values ≤ 0.1 and 0.2 were defined as low in the EGFR panel and c-Met panel, respectively. The median TGF-β1 expression was used as the cutoff for the classification of samples into high and low expression groups. c and e Tumor volume curves for PDX models treated with the indicated kinase inhibitor at the indicated doses. d Tumor growth inhibition in PDX models treated with c-Meti SCC244 or capmatinib. Error bars represent the mean ± SEM (at least 6 mice per group)

