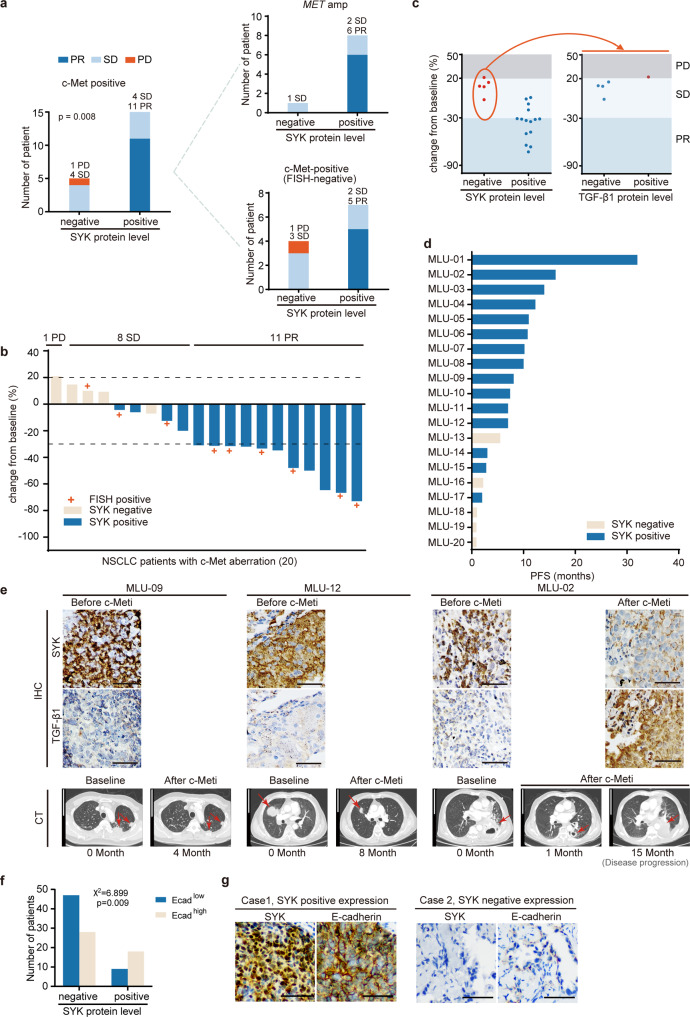
Fig. 5.
Clinical applications of the SYK-positive subtype and the SYK-negative/TGF-β1-positive subtype in c-Met-positive NSCLC patients receiving c-Met-targeted therapy. a Distribution of the therapeutic response of c-Met-positive patients classified as SYK-positive and SYK-negative. b Waterfall plot of the maximum change from baseline of the longest tumor diameter for patients with evaluable tumors in the c-Met-positive cohort. c Patients treated with the indicated c-Meti (as determined by the maximum decrease) were stratified according to SYK expression (positive vs. negative) (left) based on IHC analysis to predict the treatment response. In the subgroup with negative SYK expression, patients treated with the indicated c-Meti were further stratified by TGF-β1 expression (right) to predict the treatment response. d PFS results (months) obtained with the indicated c-Meti in c-Met-aberrant subgroups. e Representative SYK and TGF-β1 staining (upper) and chest CT images of patients before and after targeted therapy (lower). Detailed case information is presented in the Methods section. The arrow indicates the location of the tumor. Scale bars for the IHC image, 50 μm. Scale bars for the CT image, 10 cm. Clinical assessment was performed based on RECIST, version 1.1. Patients with a CR or PR were considered responders, while patients with PD were considered nonresponders (de novo resistance). f Crosstab analysis with Pearson chi-square test of E-cadherin and SYK expression in 102 NSCLC specimens. g Representative IHC images of SYK and E-cadherin staining. Scale bars, 50 μm

