
Figure 2.
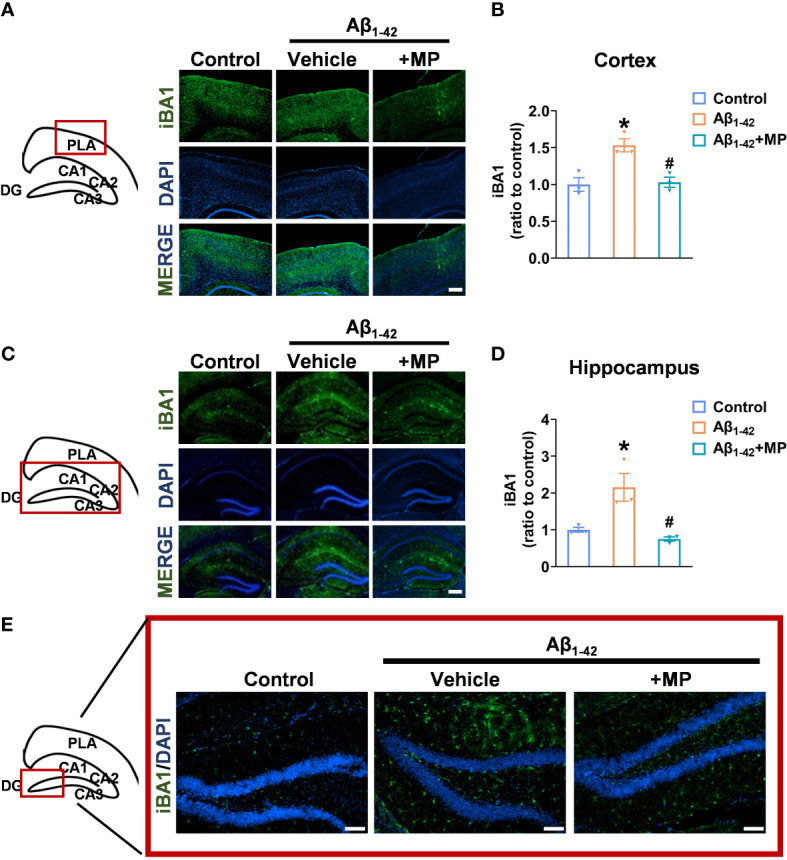
MP inhibits the excessive activation of microglia in the cortex and hippocampus of AD mice. (A) Representative fluorescence micrographs showing iBA1 expression in the cortex (Scale bar, 1000 μm). (B) Quantification of the total number of iBA1+ cells in the cortex (n = 3). (C) Representative fluorescence micrographs showing iBA1 expression in the hippocampus (Scale bar, 1000 μm). (D) Quantification of the total number of iBA1+ cells in the hippocampus. (n = 3). (E) Representative fluorescence micrographs showing iBA1 expression in DG (Scale bar, 200 μm). Data are shown as mean ± SEM (n = 3). *P < 0.05 vs. control group; #P < 0.05 vs. Aβ1-42-induced group.