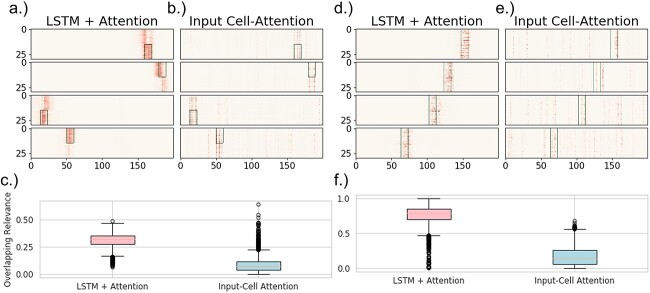
Fig. 3.
(a-c) The results from the analysis of the boxes dataset. Four examples of resulting maps from both (a) LSTM+attention and (b) input-cell attention, where the green rectangle is a mask representing the truly relevant information (i.e., box location). (c) Boxplots of the overlapping-values metric over all 3,000 samples for both models. The overlap is defined as the percentage of the total sum of the maps that are within the relevant area seen in the top figures. (d-f) Results from the analysis of the VAR dataset. The figures are organized the same as the figures for the boxes results. (d) LSTM+attention and (e) input-cell attention are four examples of the maps, where the green rectangles are the ground-truth relevancies (i.e. where the auto-regressive signal changes). Each baseline image has a certain underlying transition matrix, as computed by VAR. Each sample is interpolated with one of two different transition matrices, depending on the class label (the label along the y-axis) within the area demarcated by the green rectangles. (f) Boxplots of the overlapping-values metric over 3,000 held-out samples for both models. Both experiments represent two separate ideas or class-relevant patterns. The boxes data contains a feature specific pattern that aligns certain rows (e.g. components) with the classification label, but also disregard any temporal information. The VAR data contains connectivity patterns (estimated by the transition matrices), or how the interactions between rows/components relates to the classification label.

