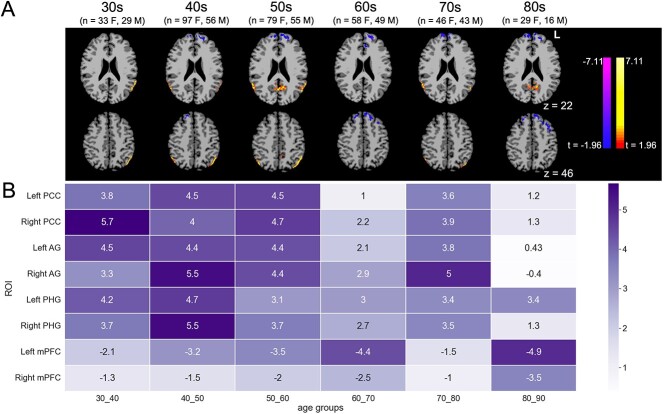
Fig. 2.
A) Sex differences in DMN ICD, by decade (females minus males, P < 0.05/P < 0.05) and B) heatmap of scores representing the results of 2-tailed, independent samples t-tests between each sex’s average connectivity values for each ROI (color gradient labeling denotes absolute values of t-values; negative scores indicate higher ICD values in male subjects). Sex differences in PHG peak in the 40s, whereas sex differences in PCC and AG are generally highest in the 5th and 6th decades; men’s higher within-network connectivity from mPFC peaks in the 7th and 9th decades (F, female; M, male).

