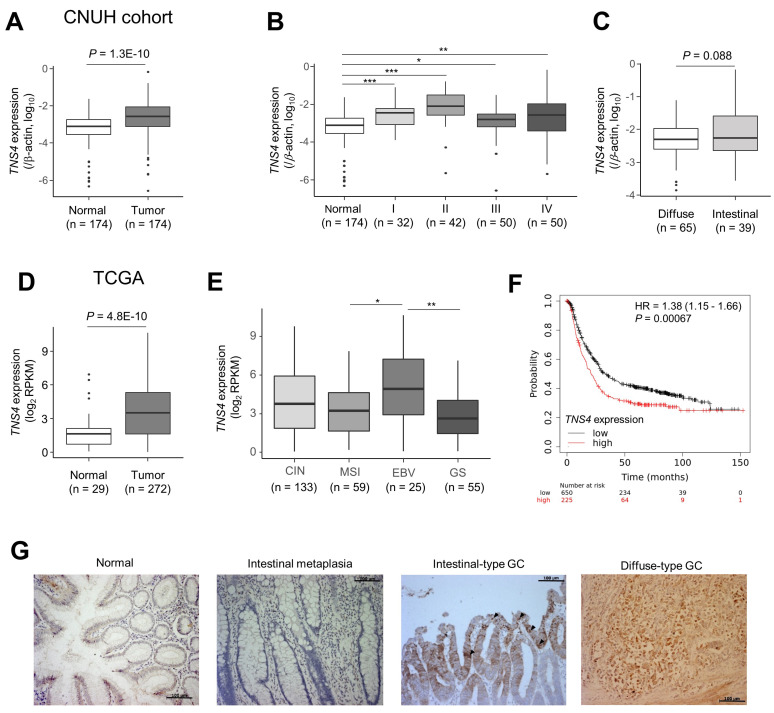
Fig. 2. TNS4 was upregulated in primary gastric cancer (GC).
(A) TNS4 mRNA expression, relative to that of β-actin, in the paired gastric normal and tumor tissues (n = 174) from the Chungnam National University Hospital (CNUH) cohort. TNS4 expression was measured by qRT-PCR. Statistical significance between normal and tumor tissues was inferred by using the paired t-test. Each box plot shows the median and 25th and 75th percentiles, and the dots represent outliers. (B and C) TNS4 expression status was stratified by (B) tumor stage (I, II, III, and IV) and (C) Lauren classification. *P < 0.05, **P < 0.01, ***P < 0.001 (Mann–Whitney U-test). (D and E) Expression of TNS4 analyzed using TCGA RNA sequencing data. Comparisons (D) between normal and GC tumor tissue samples and (E) among molecular subtypes of GC were carried out (Mann–Whitney U-test). *P < 0.05, **P < 0.01. (F) An online database (http://kmplot.com/analysis/) was used to determine the relevance of TNS4 mRNA expression in tumor tissue to the overall survival of the individual. Kaplan–Meier survival plots in which the number-at-risk is indicated below the main plot. Hazard ratio (HR) and 95% confidence intervals, as well as the log rank P were calculated and displayed on the webpage. (G) Representative immunohistochemistry for TNS4 in intestinal- and diffuse-type GC. Paraffin-embedded sections of normal mucosa, intestinal metaplasia, and gastric tumor samples from individuals with intestinal-type or diffuse-type GC were examined for TNS4 expression. Black arrowheads indicate representative TNS4 signals in well-differentiated tumor tissue. Scale bars = 100 µm (also see Table 2).

