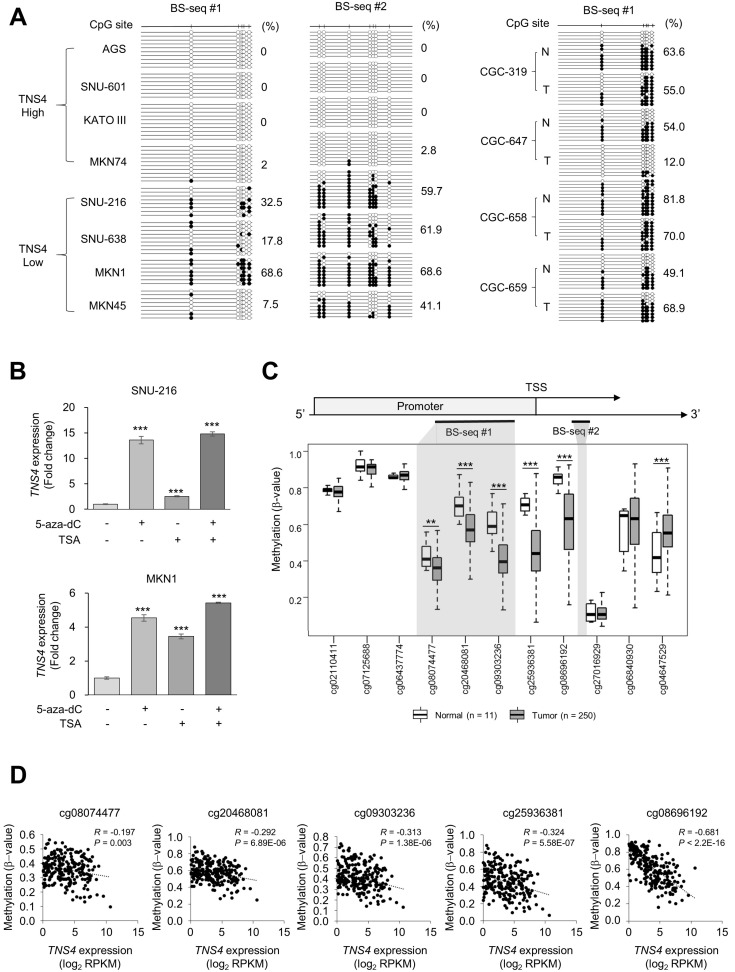
Fig. 5. Methylation analysis of the TNS4 promoter.
(A) Bisulfite sequencing (BS-seq) of gastric cancer (GC) cell lines and paired normal and tumor tissue samples. Methylation status of the TNS4 promoter in GC cell lines with high or low expression of TNS4 (Fig. 1). BS-seq regions are also indicated in Fig. 5C. These regions include the infinium human methylation 450 K BeadChip CpG probes cg08074477, cg20468081, and cg09303236. Black circles, methylated; white circles, unmethylated. Total methylation percentages are indicated. (B) TNS4 mRNA levels in GC cells treated with 5-aza-dC and/or trichostatin A (TSA). n = 8 independent experiments; mean ± SD; ***P < 0.001 (Mann–Whitney U-test). (C) The methylation level of the TNS4 promoter in normal gastric tissue (n = 11) and GC tumor tissue (n = 250) from TCGA data using Infinum Human BeadChip 450K. BS-seq regions in Fig. 5A are indicated with gray shading. TSS, transcription start site. Each box plot shows the median and 25th and 75th percentiles. Statistical significance between normal and tumor tissues was inferred by using the Mann–Whitney U-test; **P < 0.01, ***P < 0.001. (D) Pearson’s correlation analyses between TNS4 CpG methylation and TNS4 expression levels for the indicated probes from TCGA data.

