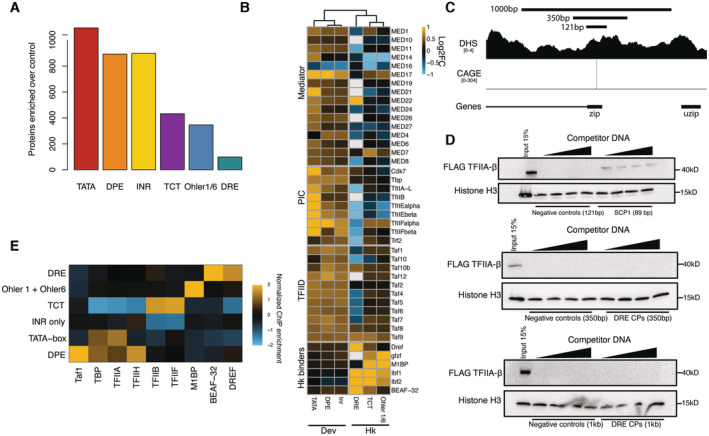
Figure 2. Developmental and housekeeping promoters bind different sets of proteins and GTFs.

- Total number of enriched proteins on the different tested pooled promoter types from the DNA affinity purification mass spectrometry (Limma P‐value < 0.05 enrichment > 0).
- Enrichments from DNA affinity purification mass spectrometry of selected proteins and protein complexes on the tested different pooled promoter types compared with negative control DNA. White represents protein not detected in the given sample. The promoters were clustered by hierarchical clustering of the mass spectrometry enrichments based on Euclidian distances, which supported the split between developmental and housekeeping core promoters (dendrogram). Three biological replicates per condition with a Limma P‐value < 0.05.
- Tested regions around the zip promoter that were used in DNA affinity purification and luciferase assay around the zip gene promoter. CAGE and DHS indicate that this promoter is accessible and transcribed in S2 cells.
- Western blots of the DNA‐bound fraction eluted off the beads in a DNA affinity purification assay. Super core promoter 1 (SCP1) was used as a positive control to bind TFIIA‐β‐FLAG (top panel). DRE promoter pools of varying lengths were assayed for their ability to bind TFIIA. Sonicated salmon sperm DNA was used as competitor DNA and titrated from 100 ng to 1.6 μg per reaction. Histone H3 was used as an abundant nonspecific DNA interacting protein for loading control. From top to bottom we have used promoter fragments ranging at 121 bp, 350 bp and 1 kb in length.
- ChIP‐seq signal of GTFs and select housekeeping promoter binders from Drosophila S2 cells and embryos normalized to nascent transcription level as measured by PRO‐seq at the respective promoter types and converted to z‐scores.
