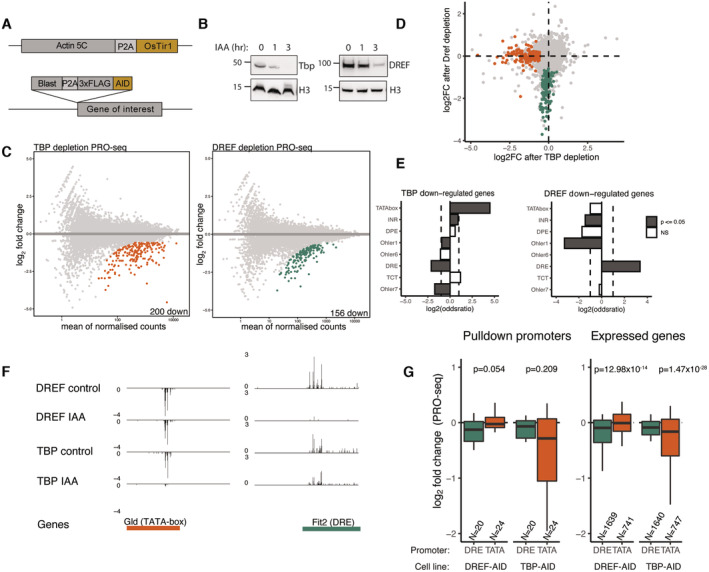
Strategy for generating endogenously tagged AID cell lines. An AID‐3xFLAG endogenous knock‐in was generated in the N terminus of either DREF or TBP in a background cell line stably expressing the Tir1 ligase downstream of Actin5c.
Western blot on FLAG‐tagged TBP and DREF 0,1 and 3 h after auxin addition showing protein degradation.
PRO‐seq measurement after 6 h of auxin addition to the TBP or DREF AID‐tagged cell lines, MA plots represent colored genes which are significantly downregulated compared with no auxin control (fold change > 1.5 down; FDR < 0.05). Two biological replicates per conditions.
Overlap of the TBP and DREF depletion PRO‐seq. Green and orange colored dots represent TBP‐ and DREF‐dependent promoters, fold change > 1.5 down & FDR < 0.05.
Fisher's exact test for motif enrichment in TBP and DREF downregulated promoters compared with all expressed promoters. Log2 of the Odds ratio displayed. The dashed lines are set at a value of 1 and −1.
Genome tracks of PRO‐seq data indicating examples of genes that are dependent on TBP or DREF. Glad is a gene with a TATA‐box promoter, while Fit2 is a gene with a DRE promoter.
Differential PRO‐seq signal across TATA‐box and DRE promoters used for the DNA affinity purification (left) or all expressed TATA‐box and DRE motif‐containing promoters (right). P‐values from a two‐sided Wilcoxon test are provided (note that despite similar magnitude of change, the comparisons on the left are not significant due to low numbers of promoters in the compared groups). Boxes represent the upper and lower quartiles, with the middle band at the median. The whiskers represent the upper and lower 5th percentiles.

