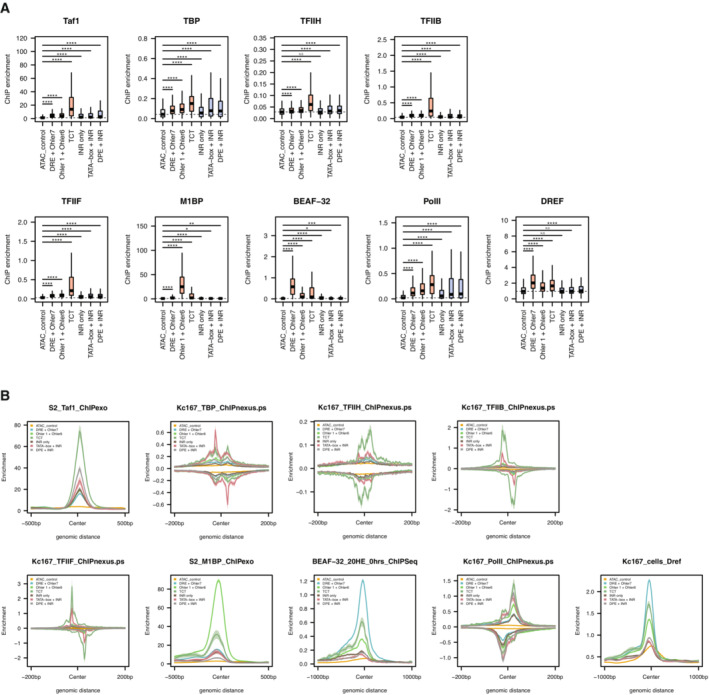
Figure EV3. Distribution of GTFs at developmental and housekeeping promoter.

- Box plots representing ChIP‐seq signal of available GTFs and sequence‐specific TFs on the six different promoter types tested from Drosophila melanogaster embryos centered on the TSS (200 bp to +200 bp). Wilcoxon test. Boxes represent the upper and lower quartiles, with the middle band at the median. The whiskers represent 1.5 times the interquartile range across two biological replicates, outliers not shown. (****P < 1e‐5, ***P < 1e‐3, **P < 1e‐2, *P < 5e‐2, N.S = not significant).
- Meta‐plot of ChIP‐seq signal of available GTFs and sequence‐specific TFs (as in panel H) on the six different promoter types centered on the TSS.
