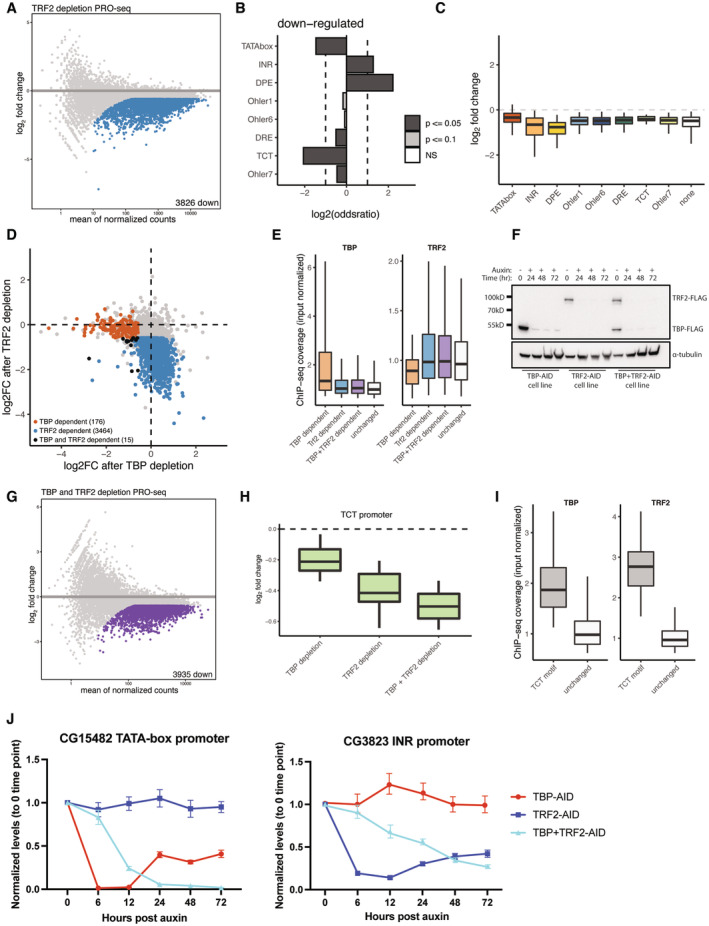
PRO‐seq was performed upon a 6‐h auxin treatment of Trf2 depletion. Colored dots represent significantly downregulated genes (fold change > 1.5 down; FDR < 0.05).
Motif enrichment analysis of gene promoters downregulated upon Trf2 depletion using a Fischer test, log2 of the odds ratio is displayed. Dashed lines are set at a value of 1 and −1.
Box plot representation of Trf2‐depletion PRO‐seq data across promoters that contain different core promoter motifs. Most developmental and housekeeping promoter types are affected with TATA‐box promoters being least affected. Boxes represent the upper and lower quartiles, with the middle band at the median. The whiskers represent the upper and lower 5th percentiles. Dashed line indicates 0.
Scatter plot of TBP and Trf2 depletion PRO‐seq at 6 h of auxin treatment. TBP‐dependent genes are colored in orange, Trf2‐dependent genes are colored in blue. Genes dependent on both TBP and Trf2 are colored in black (fold change > 1.5 down; FDR < 0.05).
ChIP‐seq coverage (input normalized) of TBP and TRF2 at TBP and/or TRF2‐dependent promoters, and all other active promoters (‘unchanged’). Orange: TBP‐dependent promoters (i.e., promoters downregulated upon TBP depletion); blue: TRF2‐dependent promoters; purple: promoters downregulated when both, TBP and Trf2 are depleted (orange, blue and purple are not mutually exclusive sets of genes); white: unaffected promoters. Boxes represent the upper and lower quartiles, with the middle band at the median. The whiskers represent the upper and lower 5th percentiles. Data were taken from two merged biological replicates.
Western blot of anti‐FLAG antibody of TBP‐AID, Trf2‐AID and a double‐tagged TBP‐AID + Trf2‐AID cell lines from a multiday time course of auxin treatment showing prolonged depletion.
PRO‐seq was performed upon a 12‐h auxin treatment of a double‐tagged TBP + Trf2 AID cell line. Colored dots represent significantly downregulated genes (fold change > 1.5 down; FDR < 0.05), left panel.
PRO‐seq signal of individual TBP or Trf2 and double depletion of both across TCT promoters (N = 55). Boxes represent the upper and lower quartiles, with the middle band at the median. The whiskers represent the upper and lower 5th percentiles across two biological replicates.
ChIP‐seq coverage (input normalized) of TBP and Trf2 on TBP across TCT promoters (N = 55), all other expressed by not changing promoters are labeled as “unchanged.” Boxes represent the upper and lower quartiles, with the middle band at the median. The whiskers represent the upper and lower 5th percentiles. Data were taken from two merged biological replicates.
qPCR on an auxin treatment time course of TBP‐ and Trf2‐dependent genes upon individual depletion of TBP or Trf2 and a double depletion of both. Error bars represent the standard deviation across three biological replicates.

