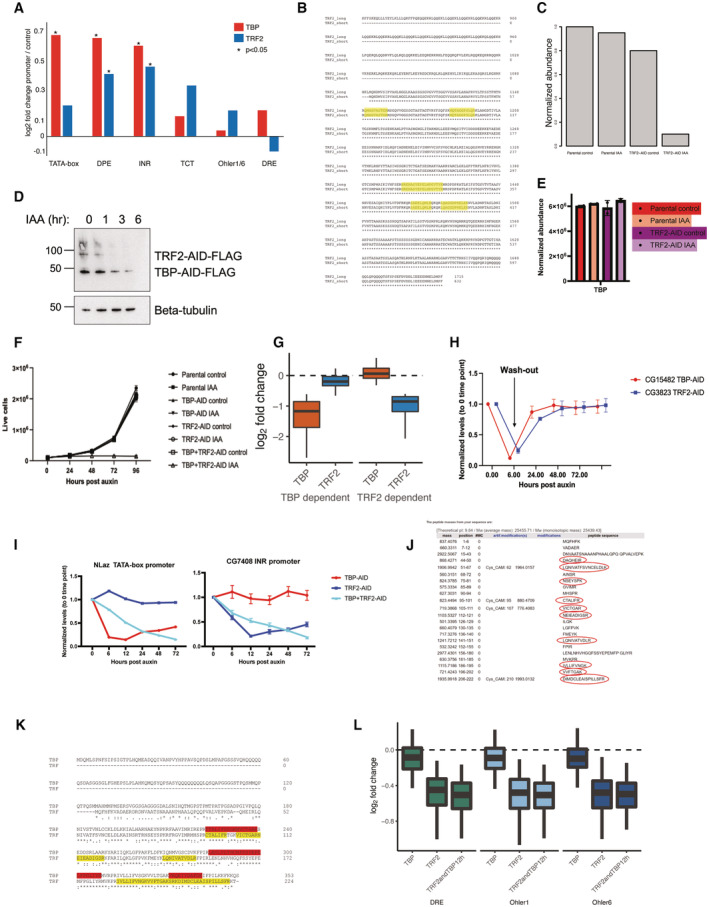
DNA affinity purification mass spectrometry enrichment values of TBP and Trf2 across the tested promoter types. Student's t‐test (P < 0.05), three biological replicates per sample.
ClustalW alignment of the short and long transcript isoforms of the Drosophila melanogaster TRF2 gene of the C‐terminal region from 840 to 1,715 amino acids. Peptides detected from label‐free mass spectrometric quantification of nuclear lysate from the TRF2‐AID cell line are highlighted in yellow. All detected peptides are shared between the two isoforms.
Normalized abundance of TRF2 peptides from lab label‐free mass spectrometric quantification of nuclear lysates from the TRF2‐AID cell line. Parental cell line is expressing the Tir1 ligase, while the TRF2‐AID cell line is endogenously tagged with 3x‐FLAG‐AID. 500 μM Auxin treatment was performed for 6 h.
Western blot of anti‐FLAG antibody on the double‐tagged TBP + Trf2 AID cell line visualizing TBP and Trf2 upon auxin addition, indicating a slower depletion kinetics of the TBP‐AID protein.
Normalized abundance of TBP in the TRF2‐AID cell line and parental OsTir1 expressing cell line under control and 12 h 500 μM auxin treatment. Error bars represent the standard deviation across two biological replicates.
Growth curve tracking the number of live cells for 4 days for individual TBP‐AID, Trf2‐AID, and double TBP + Trf2‐AID cell lines. No growth differences are observed upon the individually tagged cell lines, but the double TBP + Trf2‐AID cell line shows growth inhibition after addition of auxin. Error bars represent the standard deviation across three biological replicates.
PRO‐seq signal after TBP or Trf2 depletion (log2 fold change) is plotted for the TBP‐dependent genes and Trf2‐dependent genes. Boxes represent the upper and lower quartiles, with the middle band at the median. The whiskers represent the upper and lower 5th percentiles across two biological replicates.
Auxin washout experiment in which TBP‐AID or Trf2‐AID cell lines were treated with auxin for 6 h and then washed twice and exchanged with fresh medium to remove auxin. qPCR performed on the tested time points on two tested genes indicate they can recover to their original level in the absence of auxin. Error bars represent standard deviation across three biological replicates.
qPCR was performed on an auxin time‐course treatment experiment. The tested genes were normalized to Actin5c levels. NLaz was identified from PRO‐seq as dependent on TBP but not Trf2, and CG7408 was identified from PRO‐seq to be dependent on Trf2 but not TBP. Three biological replicates were performed, mean fold change (log2) over a Gal4‐DBD control of each sample is plotted with standard deviation with * for P ≤ 0.05.
In silico LyC and tryptic digestion of the Trf protein reveals predicted detectable peptides, which were not detected in mass spectrometry in our S2 cells, indicating a lack of Trf protein expression.
ClustalW alignment of TBP and Trf. Peptides from TBP detected by mass spectrometry are highlighted in red. Peptides predicted from an in silico digest performed on Trf (from panel H) are highlighted in yellow.
PRO‐seq data of individual TBP, Trf2 and double‐tagged TBP + Trf2 depletion at housekeeping promoters containing DRE, Ohler 1 and Ohler 6 motifs. These promoters are affected only upon depletion of Trf2 and to the same extent upon double depletion, demonstrating that TBP is dispensable for their expression and cannot substitute for Trf2 at these housekeeping promoters. Boxes represent the upper and lower quartiles, with the middle band at the median. The whiskers represent the upper and lower 5th percentiles across two biological replicates.

