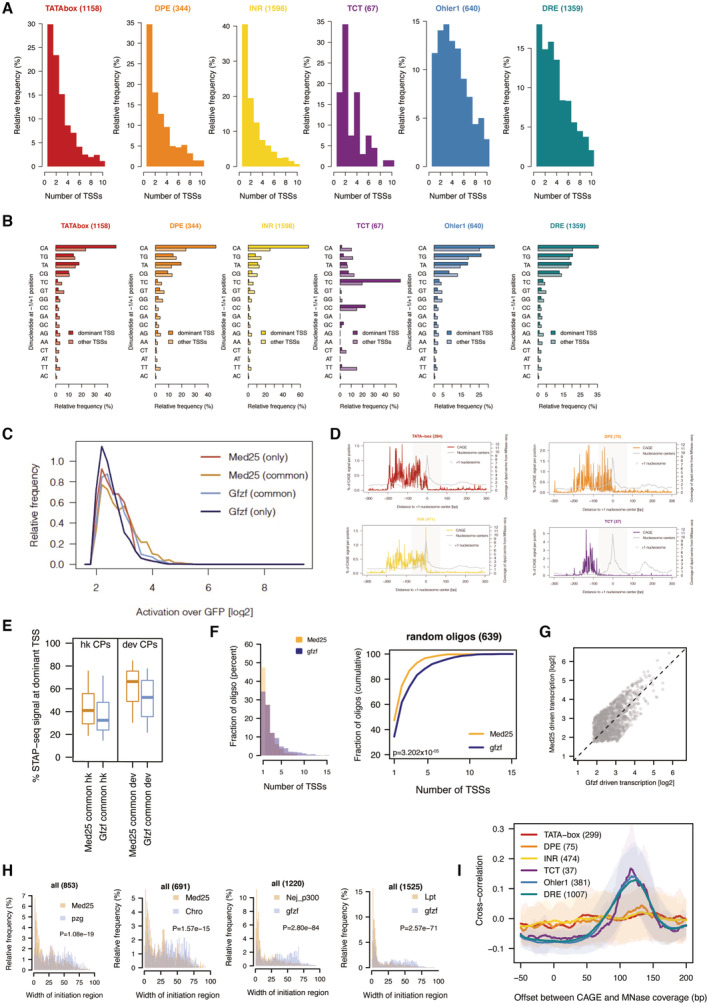
The number of CAGE‐defined TSSs in each promoter type over a 120 ± bp region. TSS was defined as a position having at least 20% CAGE signal as the dominant TSS in the tested region.
Frequency of dinucleotides at the −1/+1 position for the dominant and secondary TSSs in each promoter type in a 120 ± bp window.
Fold change (log2) of STAP‐seq signal upon GFZF or MED25 recruitment over GFP for oligos that are matched for their activation level by either one of both cofactors.
Relative CAGE signal per position on all active promoters of the indicated type aligned to the +1 nucleosome center (point of highest coverage of MNase fragment centers in +1 to +200 bp window relative to TSS).
Percent of STAP‐seq signal at the dominant TSS for activation matched oligos (one activated oligo per gene TSS) for housekeeping and developmental promoters that can be activated by both MED25 and GFZF. Boxes represent the upper and lower quartiles, with the middle band at the median. The whiskers represent the upper and lower 5th percentiles across three biological replicates.
Histogram showing the number of TSSs activated upon GFZF or MED25 recruitment on random regions that are responsive to both cofactors (left). Cumulative plot of the same data (right). P‐values: Kolmogorov–Smirnov test.
Scatter plot of the log2 fold change above GFP (i.e., activation) of promoters by GFZF or MED25 used in the analysis (i.e., matched to be activated to similar extent by both cofactors).
Histogram representing distribution of the width of the initiation region (i.e., part of the oligo covered by STAP‐seq signal) upon recruitment of MED25 or Putzig (Pzg), Med25 or Chro (Chromator), p300 or GFZF, Lpt or GFZF. For each comparison core promoters activated to similar extent by both analyzed cofactors were included. P‐values: Wilcoxon rank‐sum test.
Cross‐correlation analysis between CAGE and MNase‐seq reads relative to the dominant CAGE TSS at developmental (TATA‐box, DPE, INR) and housekeeping (TCT, Ohler1, DRE) promoters. The mean (line) and standard deviation (shaded area) for the cross‐correlation are plotted at different offsets in a base‐pair window of −50 to 200 in relation to the dominant TSS.

