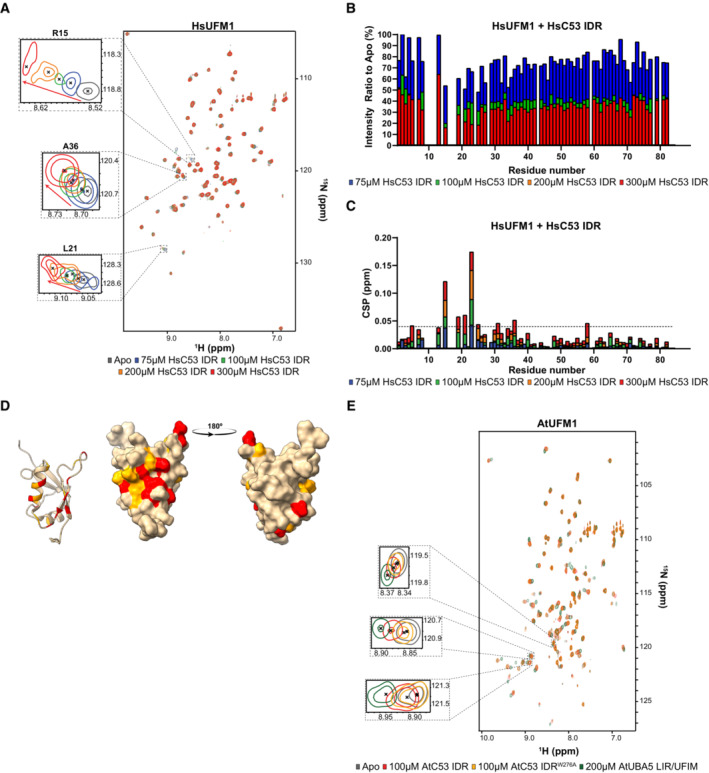
A small number of residues are affected by the addition of HsC53 IDR as shown in the HsUFM1 spectra. Overlaid 1H‐15N HSQC spectra of isotope‐labeled HsUFM1 (100 μM) in their free (gray) or bound state to 75 μM (blue), 100 μM (green), 200 μM (orange) and 300 μM (red) unlabeled HsC53 IDR. Insets of individual peaks that shift upon binding are shown.
HsC53 IDR binding to HsUFM1 causes general signal intensity drop in HsUFM1 spectra. Intensity ratio broadening of HsUFM1 (100 μM) in the presence of 75 μM (blue), 100 μM (green), 200 μM (orange) and 300 μM (red) HsC53 IDR.
Chemical shift perturbations (CSPs) in the HsUFM1 spectrum (gray) upon addition of 75 μM (blue), 100 μM (green), 200 μM (orange) and 300 μM (red) HsC53 IDR. The dashed line represents SD.
Three‐dimensional mapping of residues showing CSP in HsUFM1 NMR spectra upon HsC53 IDR binding. CSPs were mapped on the UFM1 structure (PDB: 1WXS) presented schematically on the left plot and as a surface representation in two projections on the right plot. Residues that are not affected or are slightly (CSP < 0.025), intermediately (0.025 < CSP < 0.04), or strongly (CSP > 0.04) affected by the binding are colored in tan, orange and red, respectively.
AtC53 IDR binding to AtUFM1 is similar to that of AtUBA5 and involves sAIM1. Overlaid 1H‐15N HSQC spectra of isotope‐labeled AtUFM1 (100 μM) in their free (gray) or bound state to 100 μM unlabeled AtC53 IDR (red), 100 μM unlabeled AtC53 IDRW276A (yellow) or 200 μM AtUBA5 LIR/UFIM (green). Insets of chemical shift perturbations of individual peaks are shown.