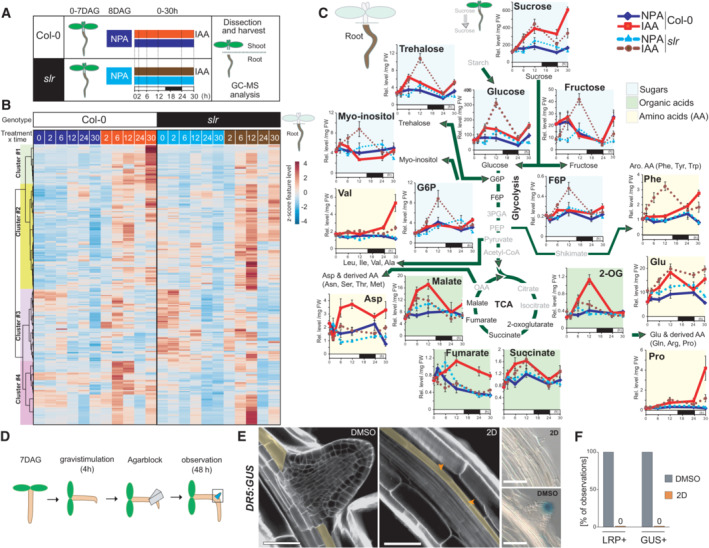
Figure 2. Increased flux within sugar glycolytic catabolism and connected pathways precede and are essential for LR formation.

-
ASchematic of the experimental setup used for the GC–MS‐based metabolomics profiling.
-
BHeatmap from a hierarchical clustering analysis (HCA) with Ward's linkage showing z‐score normalized relative levels of top 250 most intense compound‐derived spectra (Dataset EV1) exhibiting non‐constant intensity (One‐way ANOVA & FDR‐adjusted P < 0.05) across experimental conditions in roots. Main HCA clusters are color labeled.
-
CMean relative levels (± SE, n = 5 biological replicates, normalized to the ribitol internal standard and per mg fresh weight) for representative metabolites of sugar, glycolytic, tricarboxylic acid, amino acid metabolic pathways in root tissues of Col‐0 (solid lines) and slr (dashed lines) at the indicated time after IAA application. The white and black boxes below the x‐axis indicate light and dark phases during the sampling. Statistical differences for genotype × treatment (NPA‐ vs. IAA‐treated roots) are summarized in Dataset EV1.
-
DSchematic of the experimental setup for induction of LR formation upon local 2‐deoxy‐D‐glucose (2D, 10 mM) treatment.
-
ERepresentative confocal sections of calcofluor counterstained (E, n = 5 biological replicates) and differential interference contrast (DIC) images of GUS‐stained root bends (F, n = 16 biological replicates) in DR5:GUS seedlings treated as indicated 48 h after gravistimulation. In (E), orange arrows indicate the pericycle (marked in yellow). Scale bar: 50 μm.
-
FFraction of root bends forming an LRP and showing DR5 GUS staining after treatment with either control or 2D containing agar blocks (n = 16 biological replicates, ± SE).
Source data are available online for this figure.
