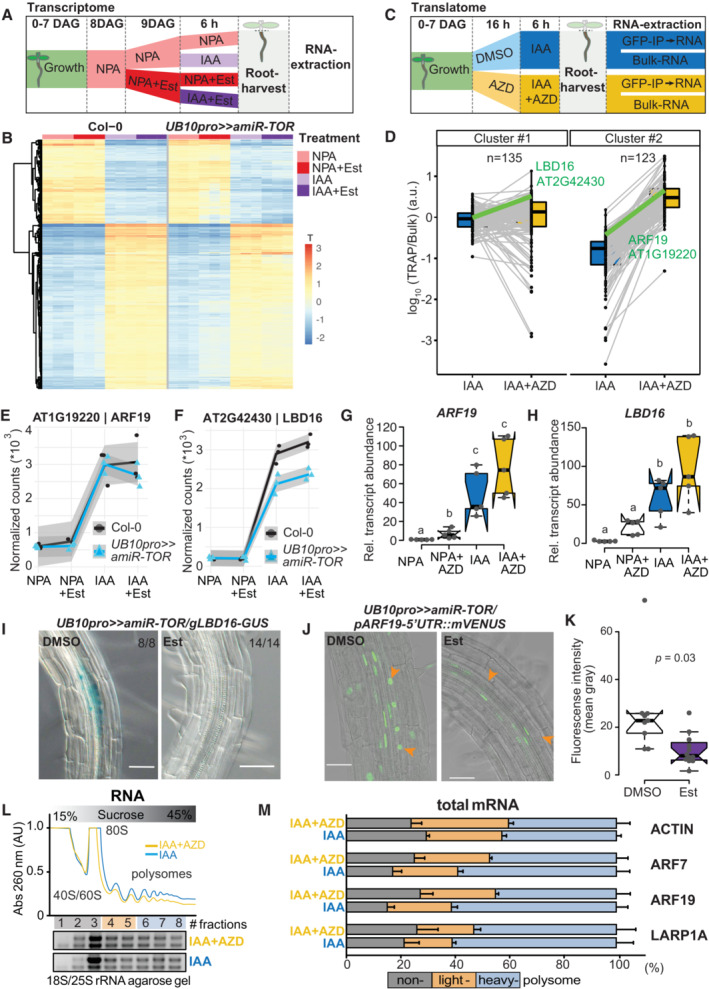
Figure 5. Effect of TOR on the auxin‐induced lateral root transcriptome and translatome.

-
ASchematic of the experimental setup used to profile the impact of TOR knockdown on the transcriptome during LR formation. IAA, NPA, and Est were all used at 10 μM concentration.
-
BHeatmap from a k‐means clustering analysis for 1,141 IAA‐dependent transcripts (log fold change > 1 & FDR < 0.05). n = 3 biological replicates.
-
CSchematic of the experimental setup used to profile the impact of TOR inhibition on the translatome during LR formation. IAA and AZD8055 were used at 10 μM.
-
DTranslational response (reads associated to ribosomes (TRAP) divided by reads in Bulk RNA) of 258 auxin‐induced genes. K‐means revealed two clusters, with mild (#1) to strong (#2) shifts in translation response upon TOR inhibition. The profiles of ARF19 and LBD16 are highlighted in green. n = 3 biological replicates.
-
E, FAbundance of ARF19 (E) and LBD16 (F) transcripts in RNAseq samples. mRNA accumulation in response to auxin is comparable for both, whether TOR is knocked down. n = 3 biological replicates.
-
G, HRelative expression levels (normalized to ACTIN) of ARF19 (G) and LBD16 (H) measured by RT–qPCR upon TOR activity inhibition with AZD8055. Comparison between samples was performed by one‐way ANOVA. Different letters indicate significant differences based on a post‐hoc Tukey HSD Test (n = 5 biological replicates, α = 0.05).
-
IDistribution of GUS‐staining in UB10pro>>amiR‐TOR/gLBD16‐GUS seedlings 24 h after bending is absent if previously treated for 24 with Est. The proportion of root bends with the depicted phenotype is indicated.
-
JRepresentative confocal images of bends of 7 DAG UB10pro>>amiR‐ TOR/pARF19‐5′UTR::mVENUS seedlings following a 24 h pre‐treatment with mock (DMSO) or ß‐ Estradiol and subsequent 24 h gravistimulation. Scale bar: 50 μm, n = 9 root bends.
-
KSignal (mean gray values) in the nuclei of the pericycle cells of UB10pro>>amiR‐TOR/pARF19‐5′UTR::mVENUS. Significant differences between DMSO and Est‐treated roots based on paired t‐test, n = 9 root bends.
-
L, MTotal lysates prepared from lateral roots treated or not with IAA and AZD were fractionated through sucrose gradients, and the relative redistribution (percentage of total) of ACTIN, ARF7, ARF19, and LARP1 mRNAs in every 8 fractions were studied by RT–qPCR analysis. (L) Polysome profiles. 40S, small ribosomal subunit; 60S, large ribosomal subunit; 80S, mono‐ribosome; polysomes, polyribosomes. AU is arbitrary units of RNA absorbance at A260 nanometers. (M) RT–qPCR analysis of mRNA redistribution through a sucrose gradient (8 fractions collected). Translation efficiency was computed as a percentage of mRNA in non‐polysome fractions (40/60/80S; fractions 1–3) against both lights (fractions 4–5) and heavy polysomes (fractions 6–8). The plot is representative of three independently performed experiments with similar results. Data are mean ± SEM.
Source data are available online for this figure.
