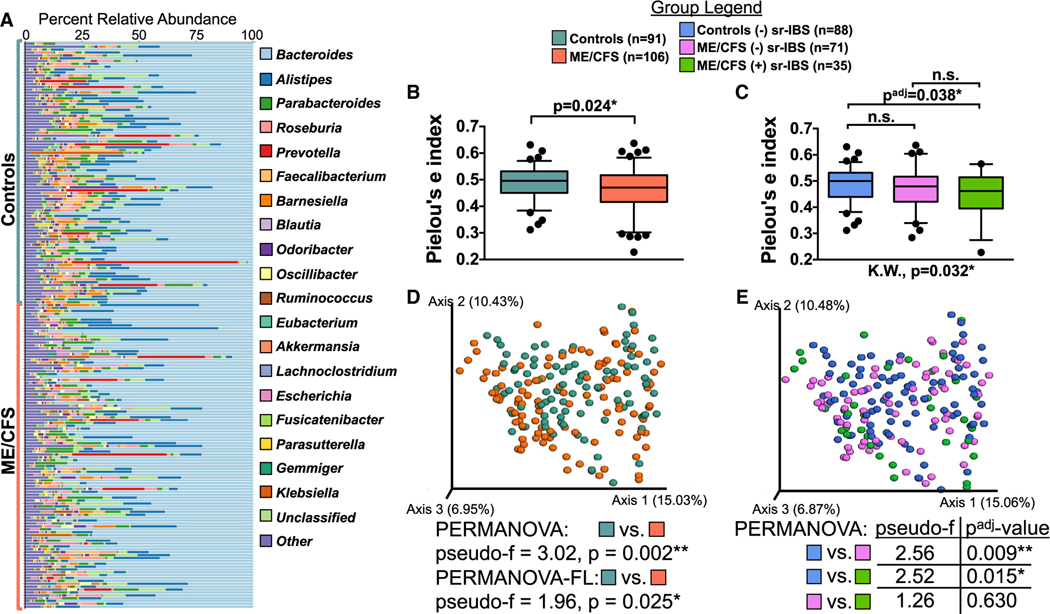
Figure 1. Gut microbiome diversity.
(A) Genus-level distribution of bacteria in the fecal microbiota of ME/CFS cases (n = 106) and healthy control subjects (n = 91).
(B and C) Distribution of microbiota alpha diversity (Pielou’s e index) comparing ME/CFS and healthy controls (B) and groups stratified by sr-IBS status (C). Box-and-whiskers plots represent the interquartile ranges (25th through 75th percentiles, boxes), medians (50th percentiles, bars within the boxes), the 5th and 95th percentiles (whiskers below and above the boxes), and outliers beyond the whiskers (closed circles). See also Figures S1A–S1D.
(D and E) PCoA plots of microbiota beta diversity (Bray-Curtis dissimilarity metric) comparing ME/CFS and healthy controls (D) and groups stratified by sr-IBS status (E).
Statistical significance: Mann-Whitney U test (B); Kruskal-Wallis test (K.W.), and Mann-Whitney U test with Bonferroni correction (padj value, C); PERMANOVA and PERMANOVA-FL (D); PERMANOVA with Bonferroni correction (padj value, E). *p or padj < 0.05; **p or padj < 0.01.

