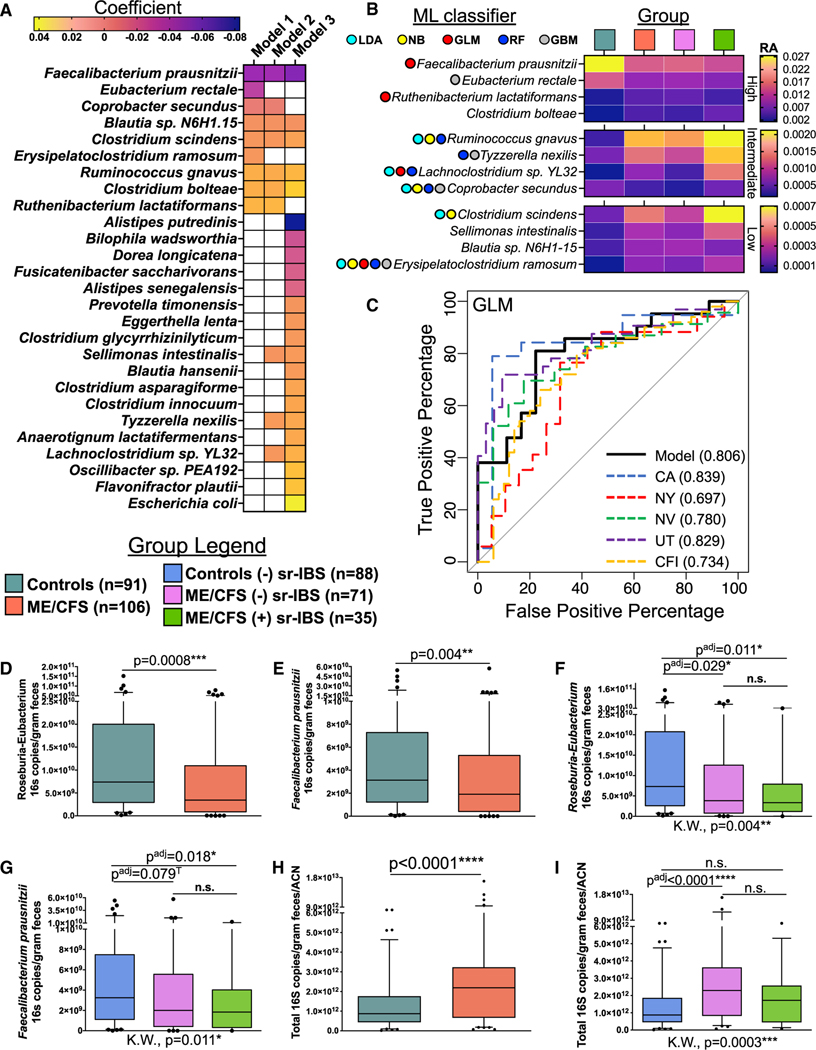
Figure 2. Differential abundance, machine-learning classifiers, and quantitation of fecal bacteria.
(A and B) Differential abundance. (A) Heatmap showing differentially abundant species identified from models 1–3 (MaAsLin2 analyses). Strength and direction of association are indicated by the color scale of the regression coefficient. FDR adjusted p value (q value) < 0.05 was considered significant; white indicates non-significant associations. See also Table S2. (B) Heatmap showing the average relative abundance (RA) of the twelve ME/CFS-specific species in unstratified and stratified groups, divided into high, intermediate, and low RA. Species selected in each ML classifier model are indicated by colored circles.
(C) ML classifiers. Generalized linear model (GLM) receiver operating characteristic (ROC) curves for classification of ME/CFS based on four bacterial species (F. prausnitzii, R. lactatiformans, Lachnoclostridium sp. YL32, and E. ramosum). AUC values are shown for the primary dataset in this study (model), by geographic sites (CA, NY, NV, and UT), and for the external validation dataset (CFI). See also Figure S2.
(D–I) Bacterial quantitation (qPCR). Distribution of Roseburia-Eubacterium (D and F) and F. prausnitzii (E and G) and total bacterial (H and I) 16S rRNA genes per gram of feces (also normalized for ACN in (H) and (I) between ME/CFS and healthy controls (D, E, and H) and among stratified groups (F, G, and I). Box-and-whiskers plots represent the interquartile ranges (25th through 75th percentiles, boxes), medians (50th percentiles, bars within the boxes), the 5th and 95th percentiles (whiskers below and above the boxes), and outliers beyond the whiskers (closed circles).
Statistical significance: Mann-Whitney U test (D, E, and H); Kruskal-Wallis test (K.W.) and Mann-Whitney U test with Bonferroni correction (padj value, F, G, and I). *p or padj < 0.05; **p or padj < 0.01; ***p or padj < 0.001; ****p or padj < 0.0001; T, trend (p or padj < 0.1).

