
Figure 5.
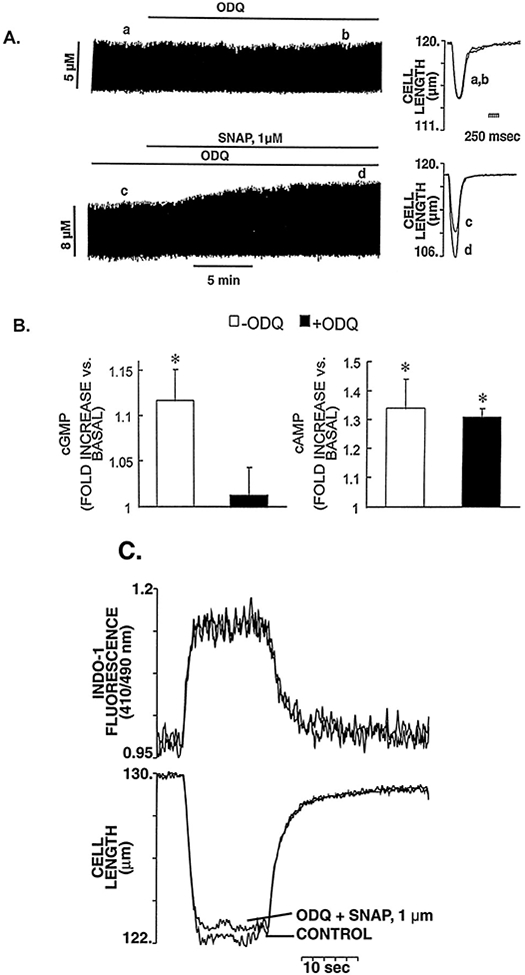
Failure of ODQ 10 μmol/L to block the positive contractile response of SNAP 1 μmol/L. A, Typical continuous chart recording of contraction amplitude in response to ODQ (10 μmol/L) alone (top tracing) and SNAP (1 μmol/L) in the continued presence of ODQ (10 μmol/L) (bottom tracing). The superimposed tracings of cell length on the right show the lack of effect of ODQ (10 μmol/L) on baseline contraction (top) and the increase of contraction amplitude in response to a low concentration of SNAP (1 μmol/L) in the continued presence of ODQ (10 μmol/L) (bottom). B, Parallel measurements of cGMP and cAMP in response to SNAP (1 μmol/L) in the presence and absence of ODQ. The results are presented as fractions of the basal values of cGMP and cAMP, 4.2±0.2 and 6.2±0.4 pmol/mg of protein, respectively. ODQ (10 μmol/L) alone did not affect basal cGMP or cAMP levels (4.1±0.2 and 5.2±0.7 pmol/mg of protein, respectively). ODQ completely abolished the SNAP-induced increase in cGMP but had no effect on increased cAMP levels. *P<0.05 vs basal level. C, Representative example of the lack of effect of SNAP (1 μmol/L) in the presence of ODQ (10 μmol/L) on the steady-state myofilament response to Ca2+ of a myocyte during tetanic contractions (10 Hz). This indicates that the positive contractile effect seen in panel A is purely the result of the increase in magnitude of the Cai.