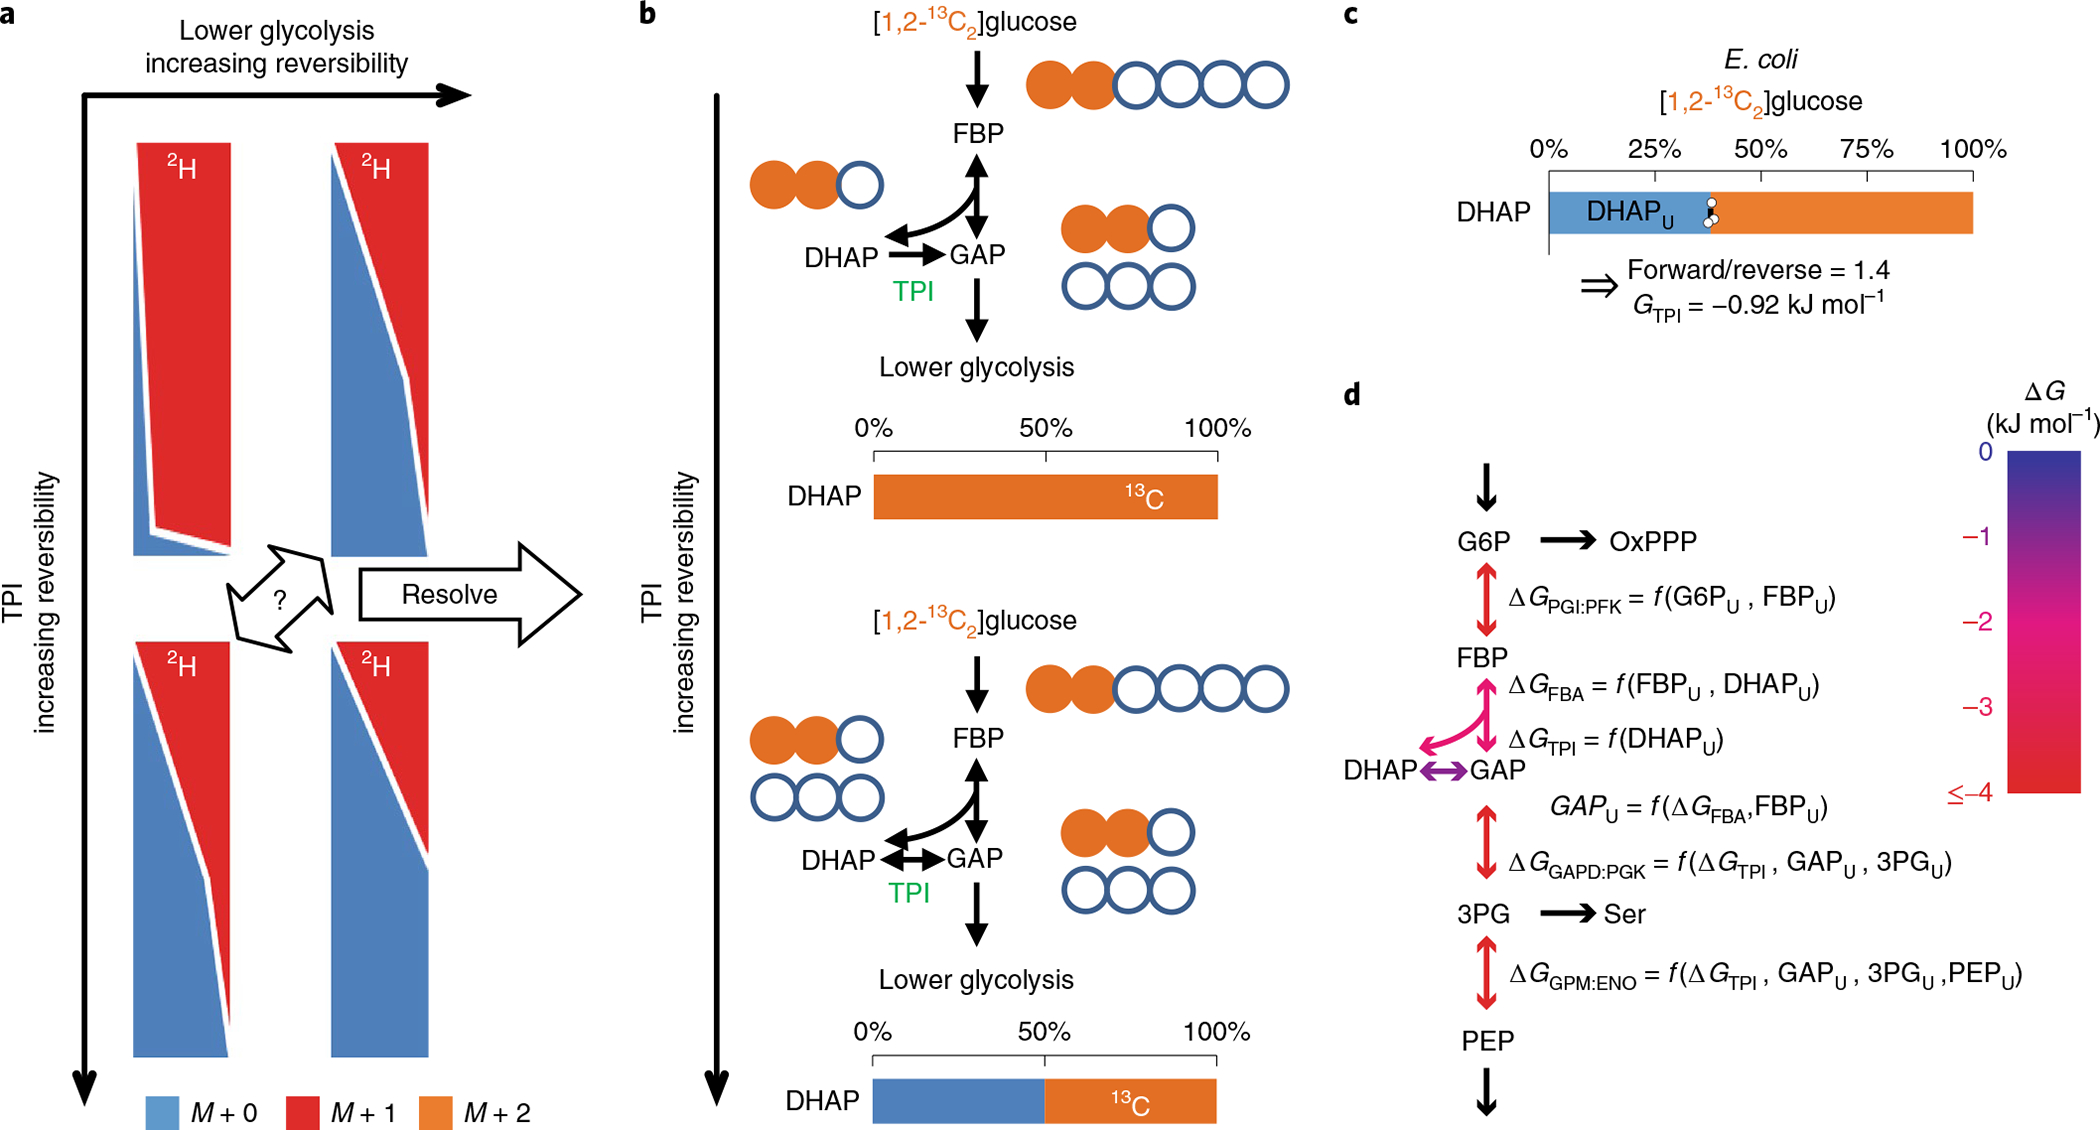
Fig. 2 |. Simultaneous 2H and 13C labeling reveals ΔG.

a, [5-2H1]Glucose tracing alone falls short because each isotope labeling gradient could be the result of varying combinations of TPI and lower glycolysis reversibility. b, If TPI reversibility is known, the reversibility and ΔG of glycolysis can be determined. [1,2-13C2]Glucose reveals TPI reversibility and ΔG. As the reverse TPI reaction introduces M + 0 DHAP, 0% M + 0 DHAP measurement implies no backward TPI flux (ΔGTPI ≪ 0), while ~50% suggests a highly reversible reaction (ΔGTPI ≈ 0). c, In E. coli, [1,2-13C2]glucose generated 40% unlabeled DHAP (DHAPU). The center and error bars represent the mean ± s.e.m. (n = 3, biologically independent samples). d, The ΔG of a reaction can be expressed as a function of the measured unlabeled fractions of primary substrate and product as well as GAPU and ΔGTPI. GAPU was obtained from FBP aldolase reversibility and FBPU. Using the 2H–13C labeling information and flux modeling, we determined the reversibility and ΔG of glycolytic reactions.
