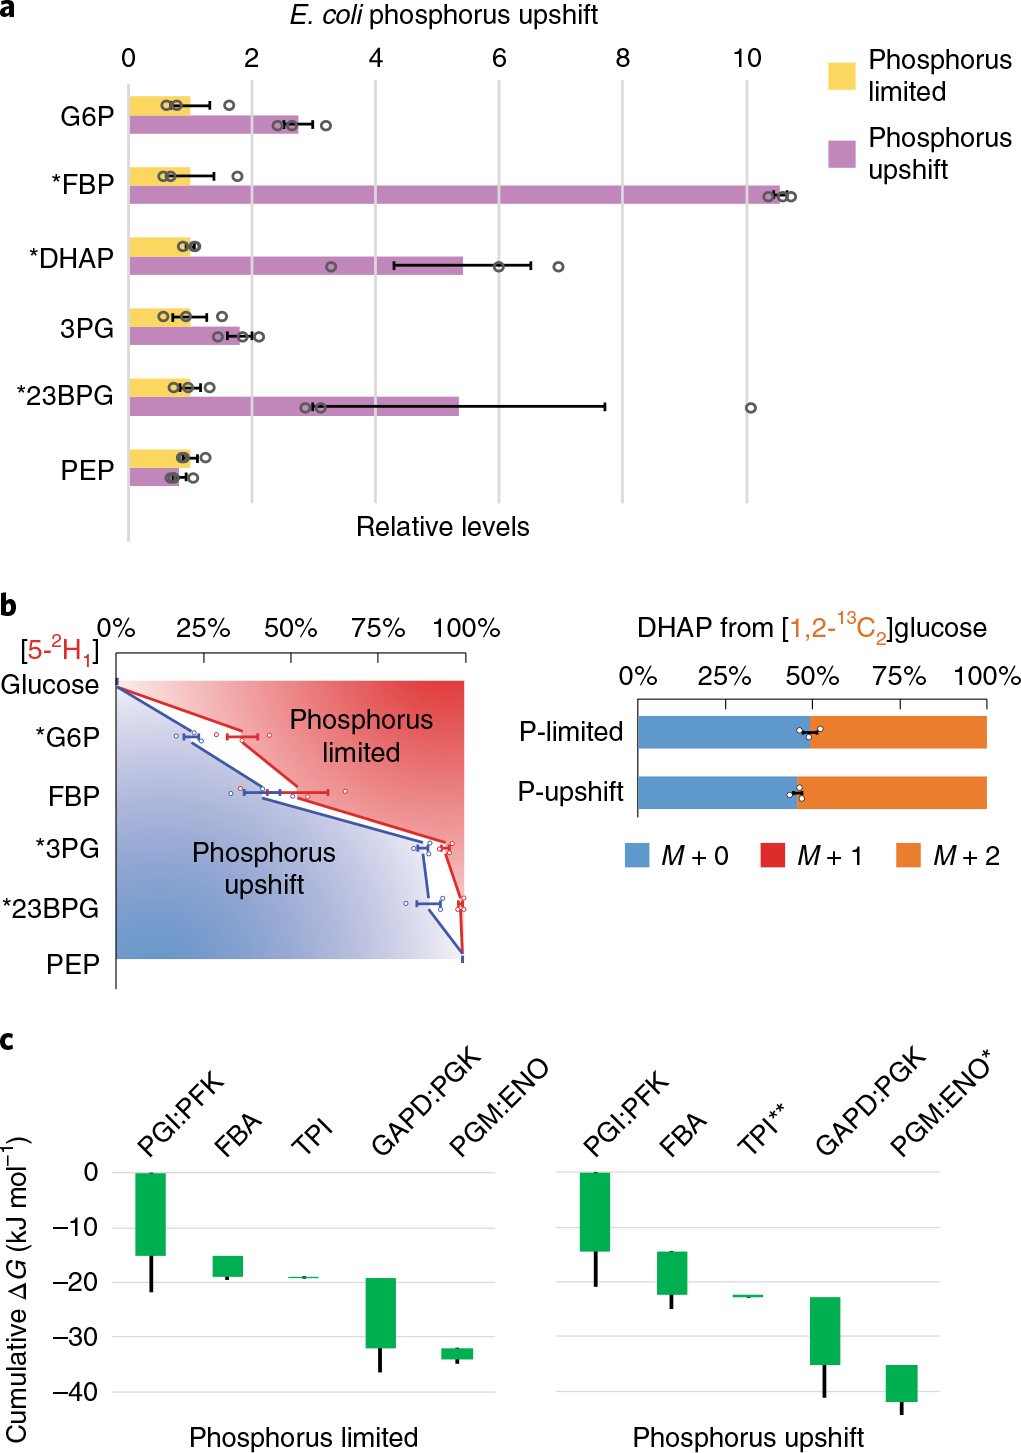
Fig. 4 |. Phosphorus upshift drives glycolysis forward.

a, Changes in relative levels of glycolytic intermediates 5 min after spiking in 1.32 mM phosphate to E. coli phosphate-limited cultures. Measurements are normalized by means of the individual metabolites in the phosphorus-limited condition. The center and error bars represent the mean ± s.e.m. (n = 3, biologically independent samples). b, E. coli cultured on [5-2H1]- or [1,2-13C2]glucose during phosphate limitation and 5 min after spiking in 1.32 mM phosphate. G6P, 3PG and 23BPG gained substantial deuterium labeling, while the unlabeled DHAP pool decreased. The center and error bars represent the mean ± s.e.m. (n = 3, biologically independent samples). c, Corresponding ΔG were inferred from the flux-modeling results that best fit the observed 2H and 13C labeling. Each of the reaction(s) ΔG (<0) is represented by the height of the green bar. The bottom edges indicate the cumulative ΔG up to the corresponding step in glycolysis. Whiskers show s.e.m.; *P < 0.05 and **P < 0.01 by two-tailed t-tests or bootstrapping (Methods).
